
Bloomberg Law 40 Under 40
What I did: Designed wireframe and prototype for honoree display; animated page topper
What I used: Figma, Illustrator, After Effects
PBS News Rebrand
What I did: Created wireframes and prototypes for site layout; designed new templates for web, social, and video content; oversaw asset distribution across broadcast and digital teams.
What I used: Figma, Illustrator, Photoshop, HTML, CSS, GitHub, WordPress, OneDrive
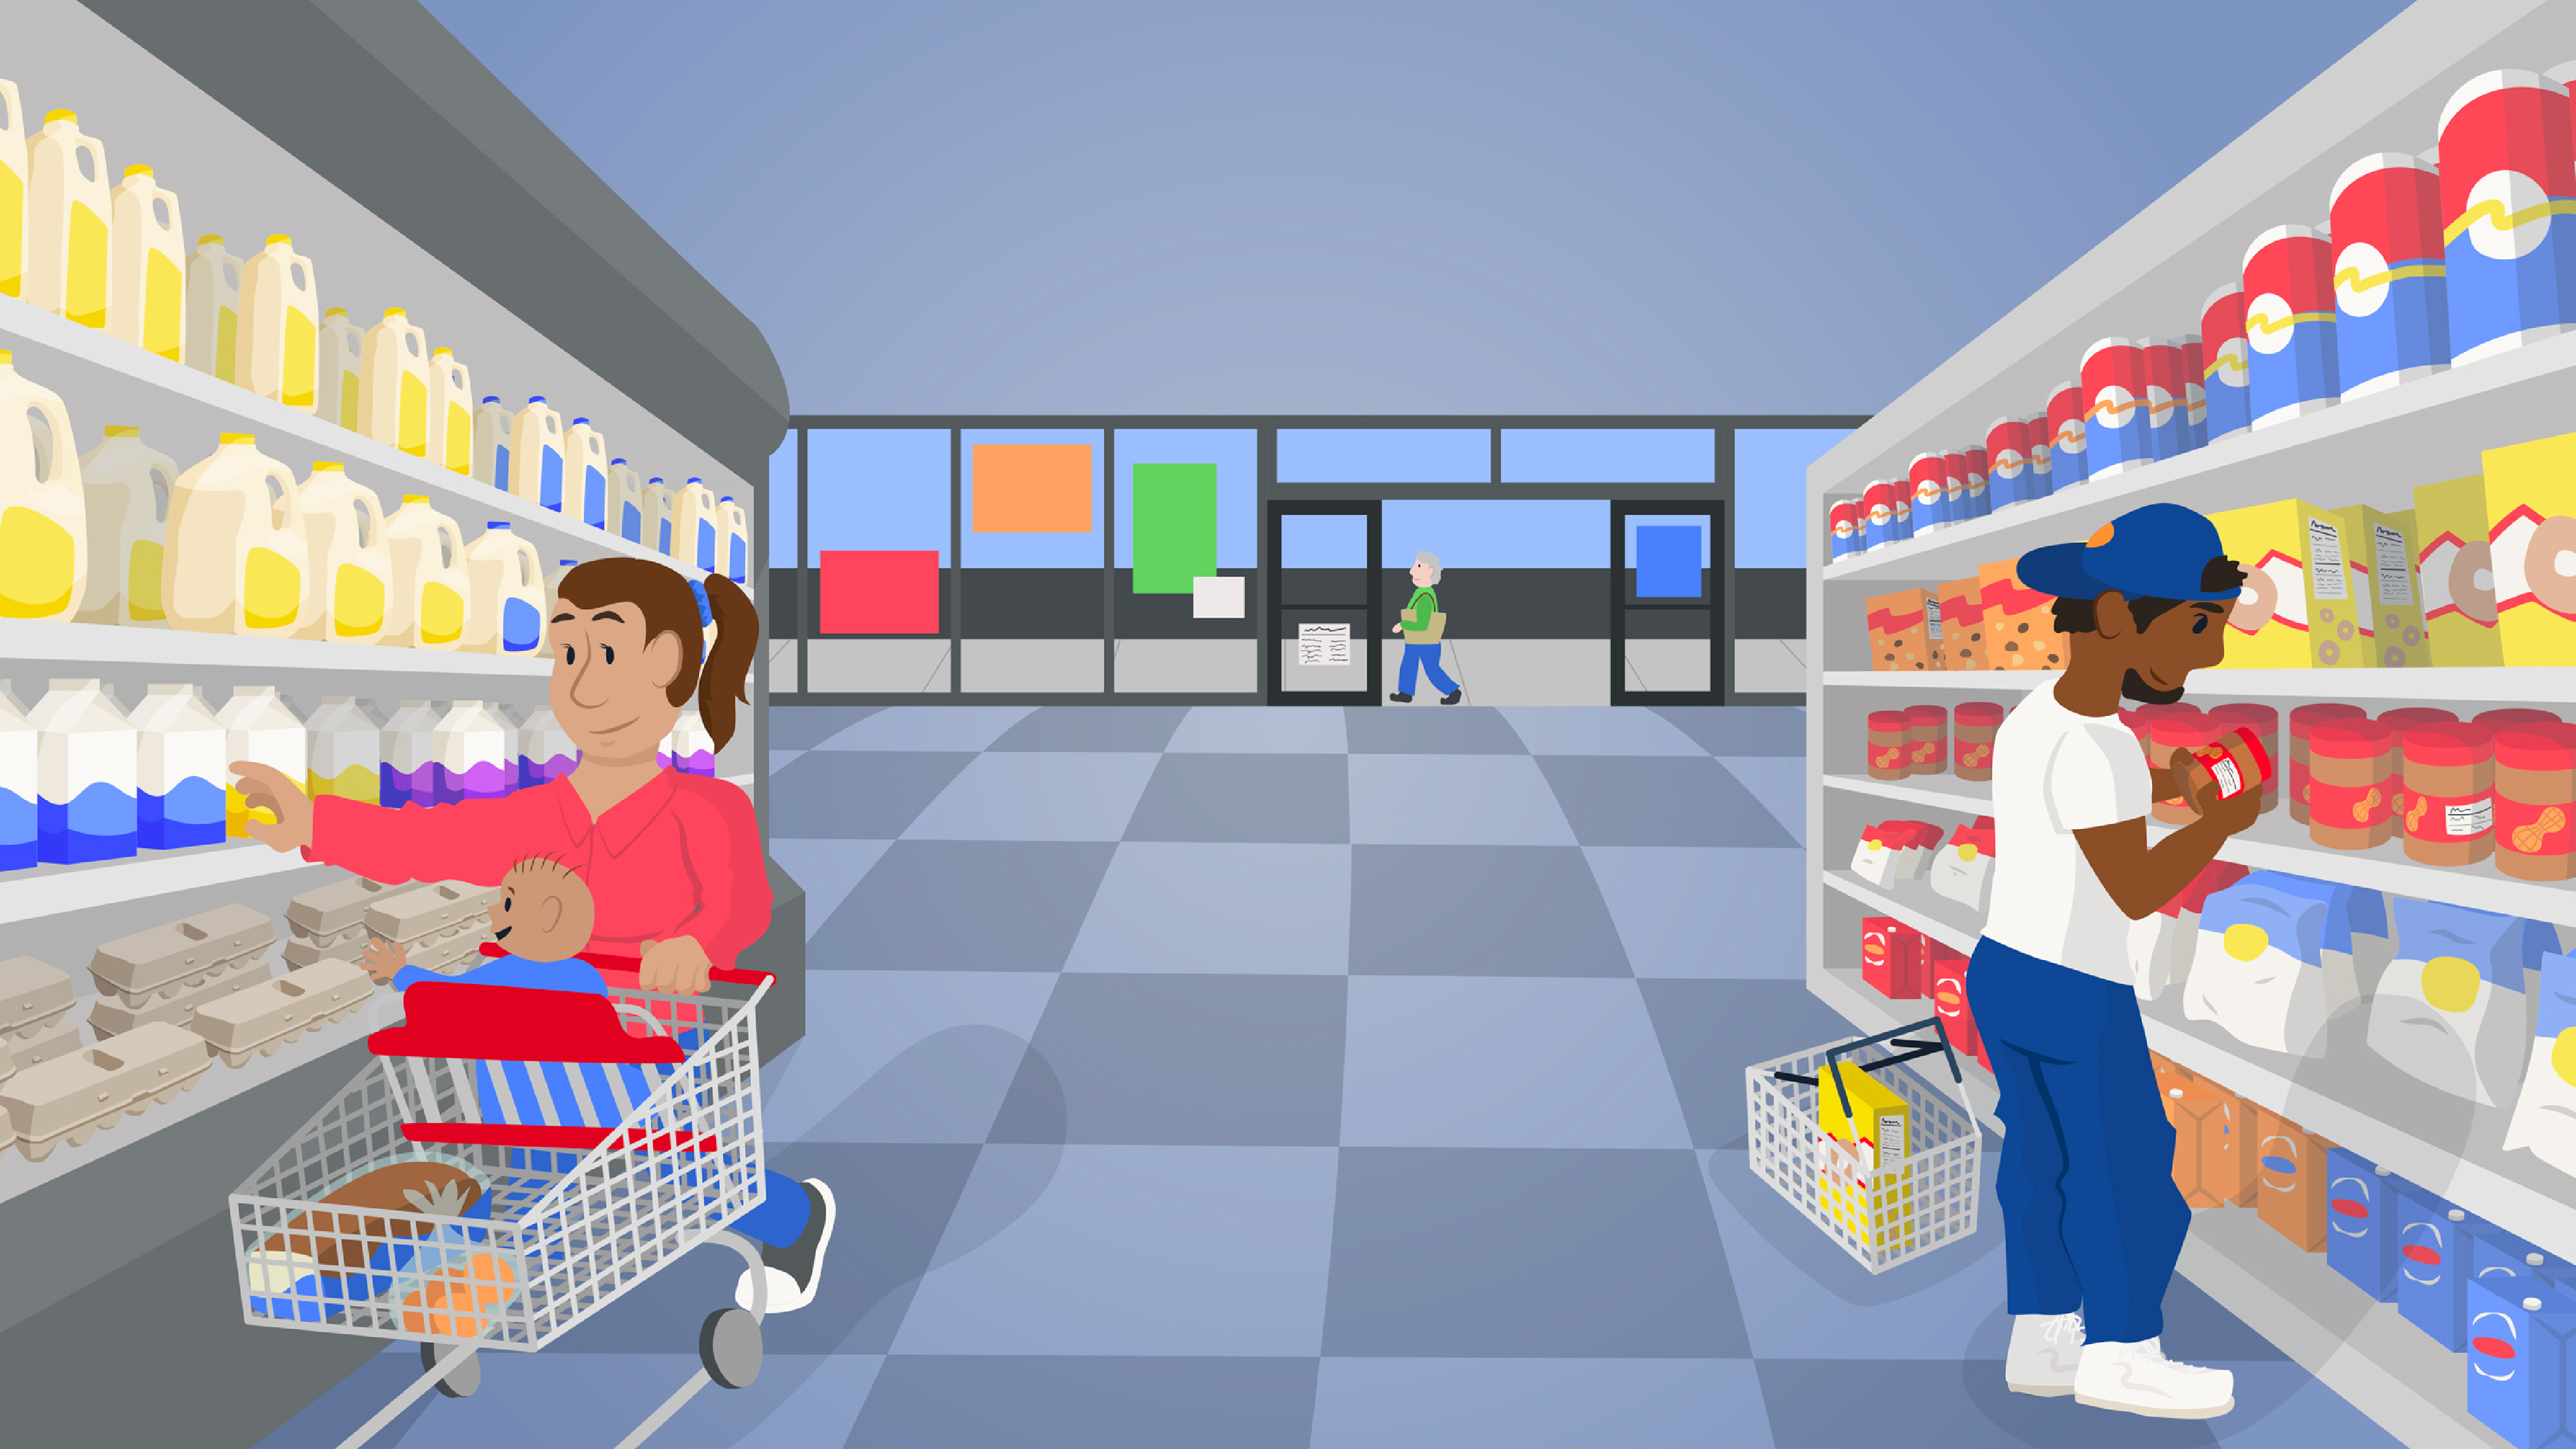
Smart Shopping Quiz
What I did: Designed, prototyped, and developed an interactive quiz web page; created illustrations for interactive assets.
What I used: Figma, Illustrator, Procreate, HTML, CSS, JavaScript, GitHub, WordPress
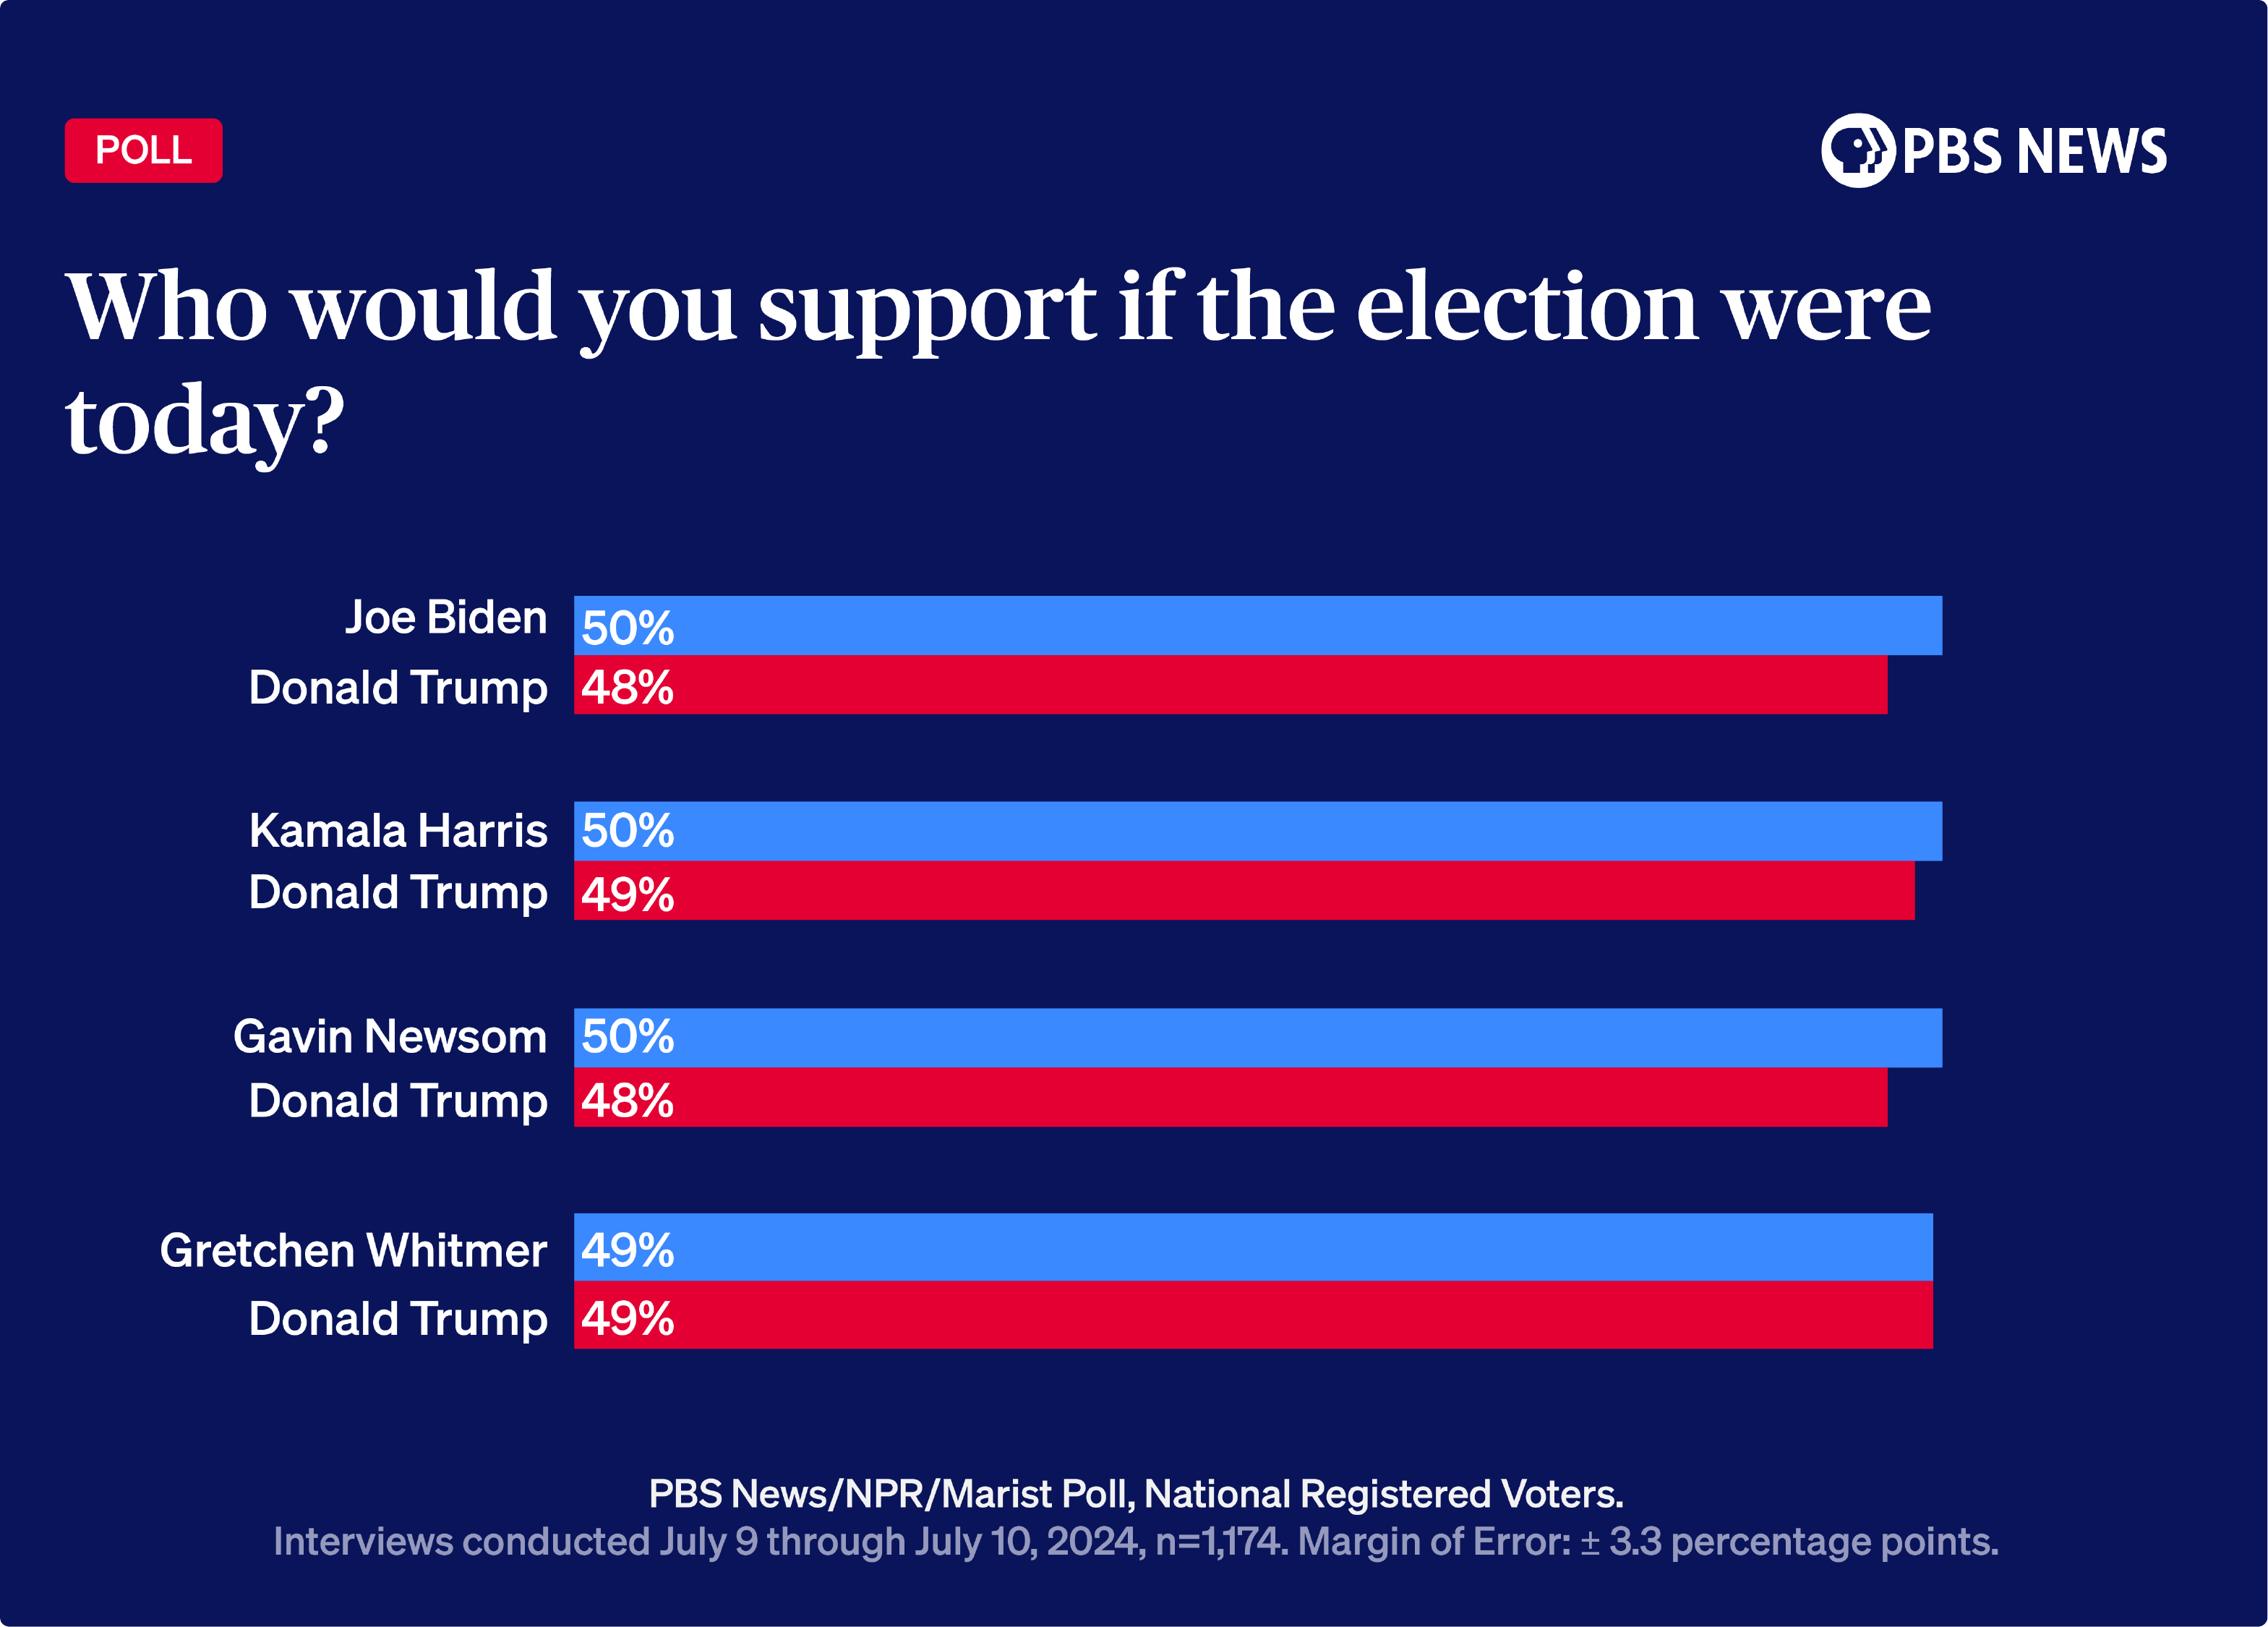
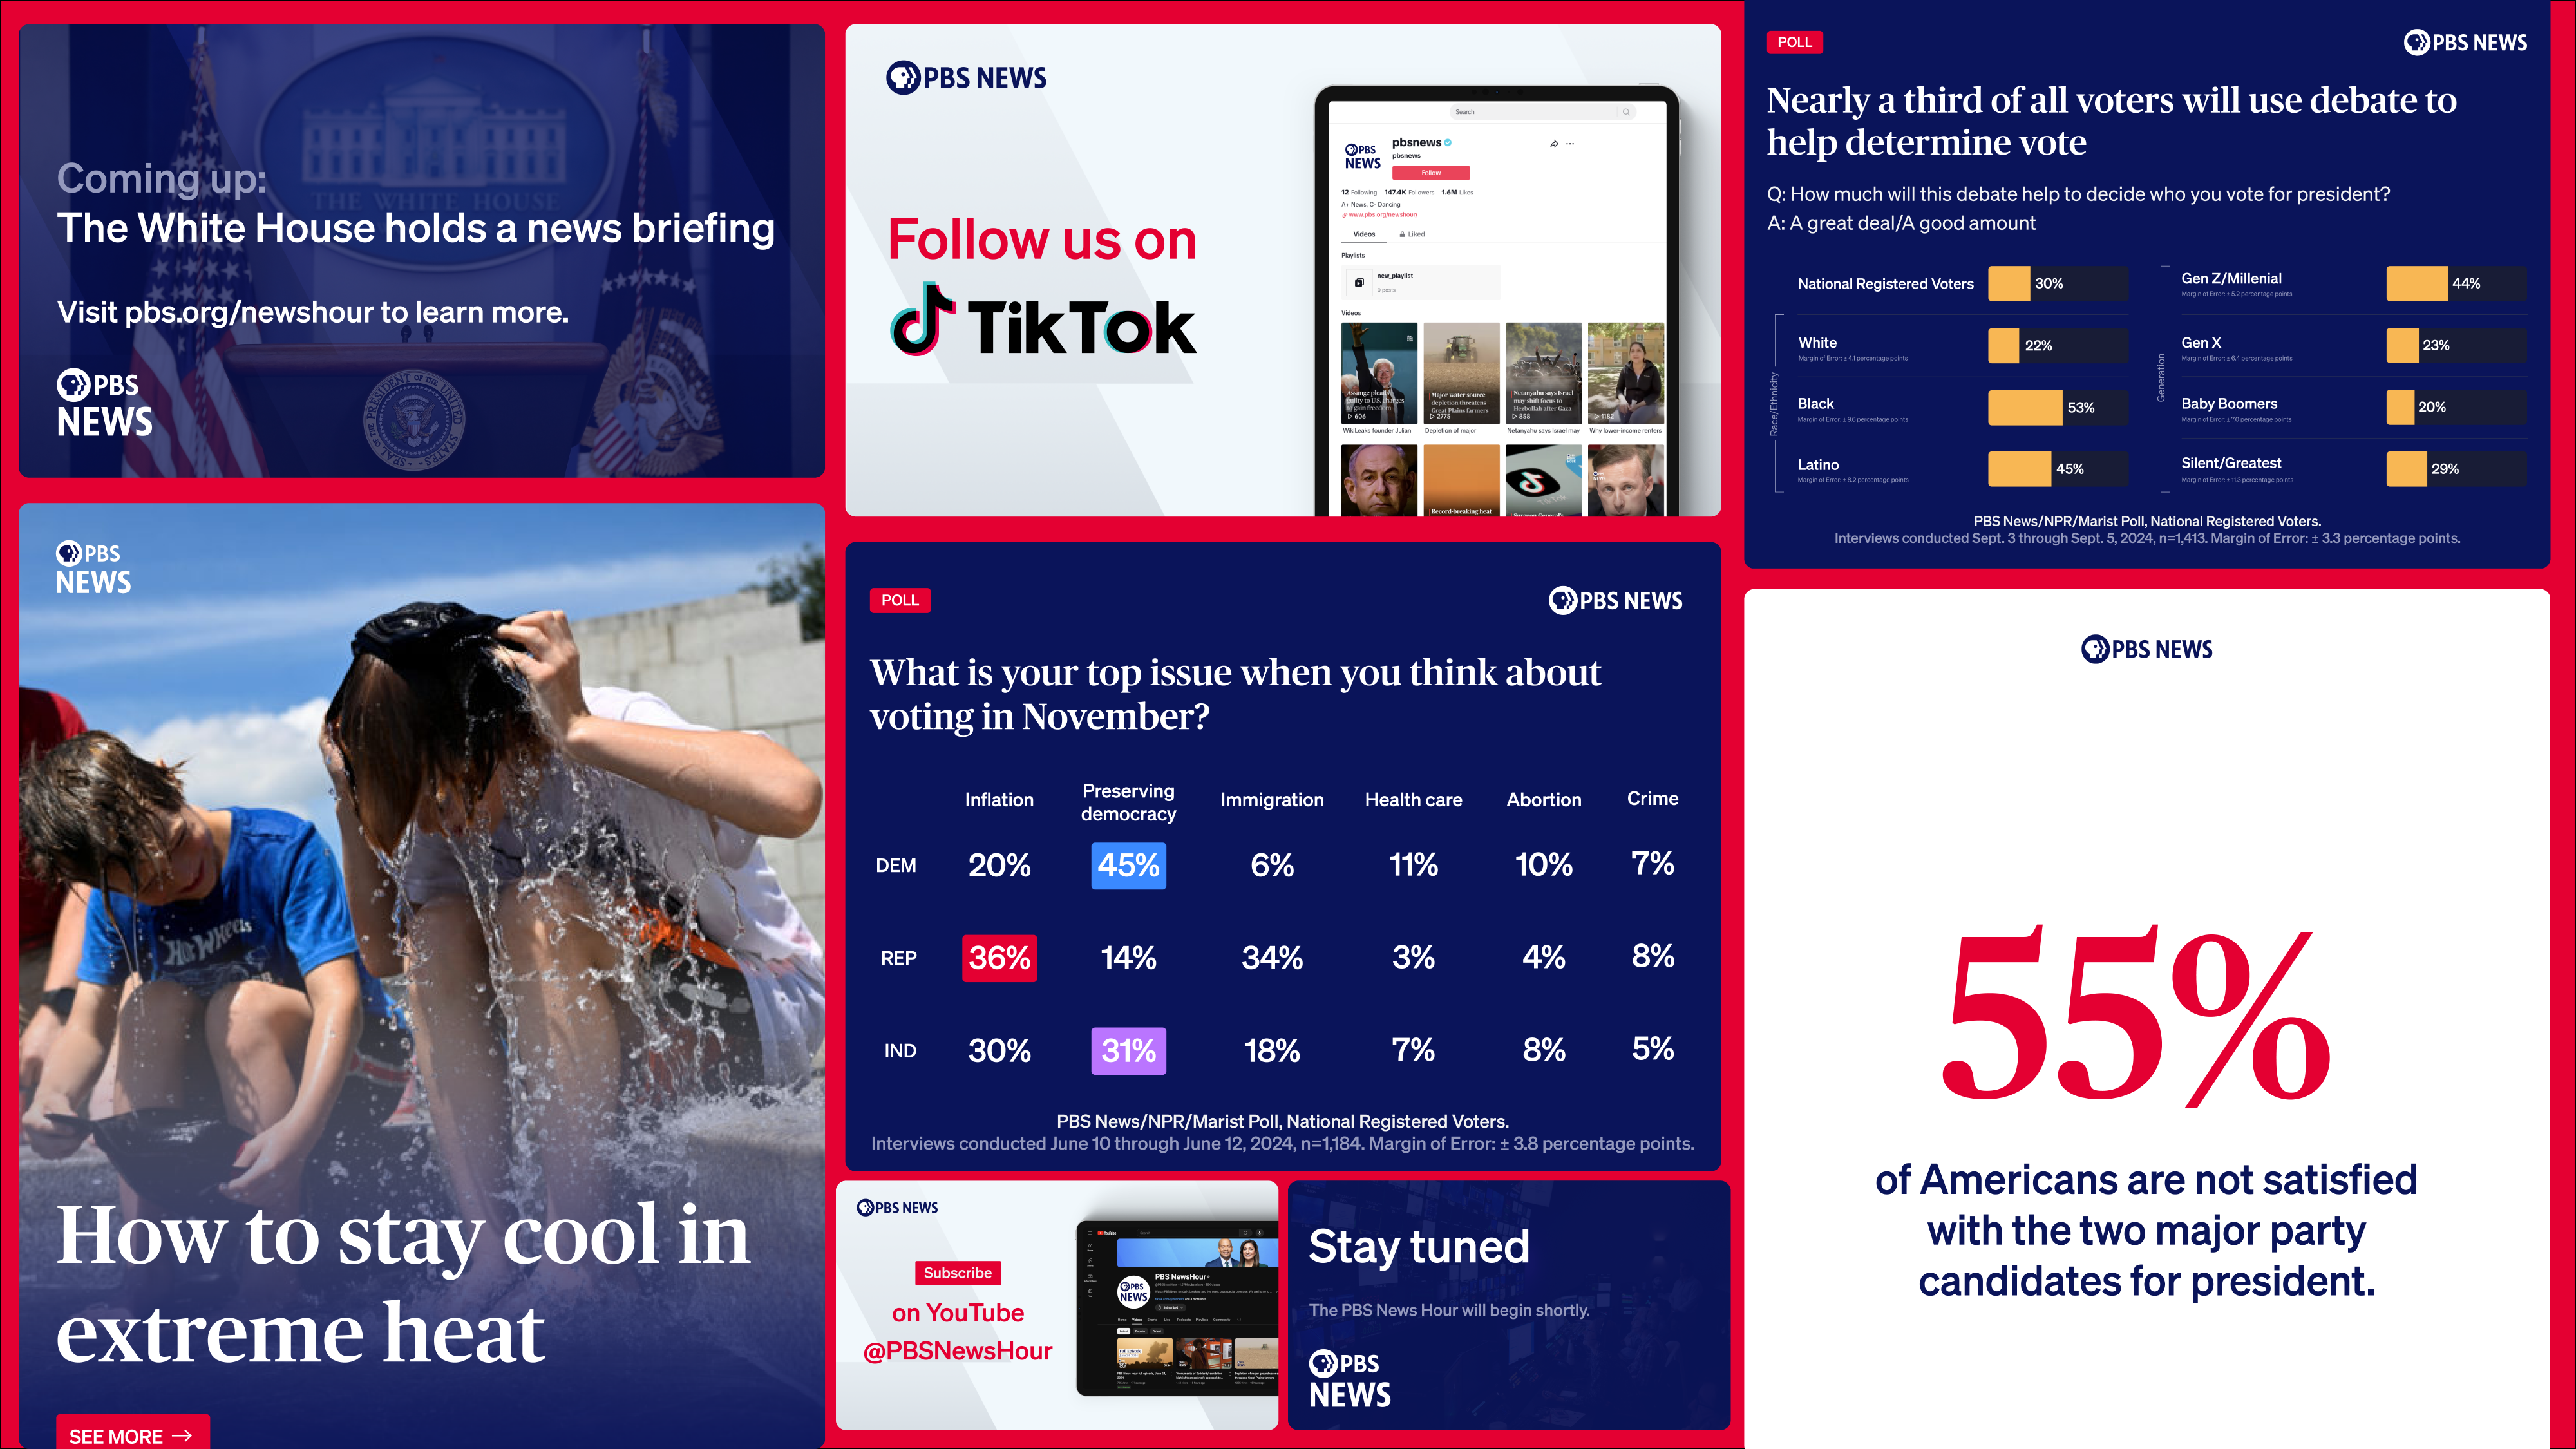
PBS News Data Visualizations Collection
What I did: Produced interactive, static, and animated data visualizations; collaborated with reporters and editors; aggregated and verified data.
What I used: Datawrapper, Carto, Illustrator, After Effects, Excel, Google Sheets, R
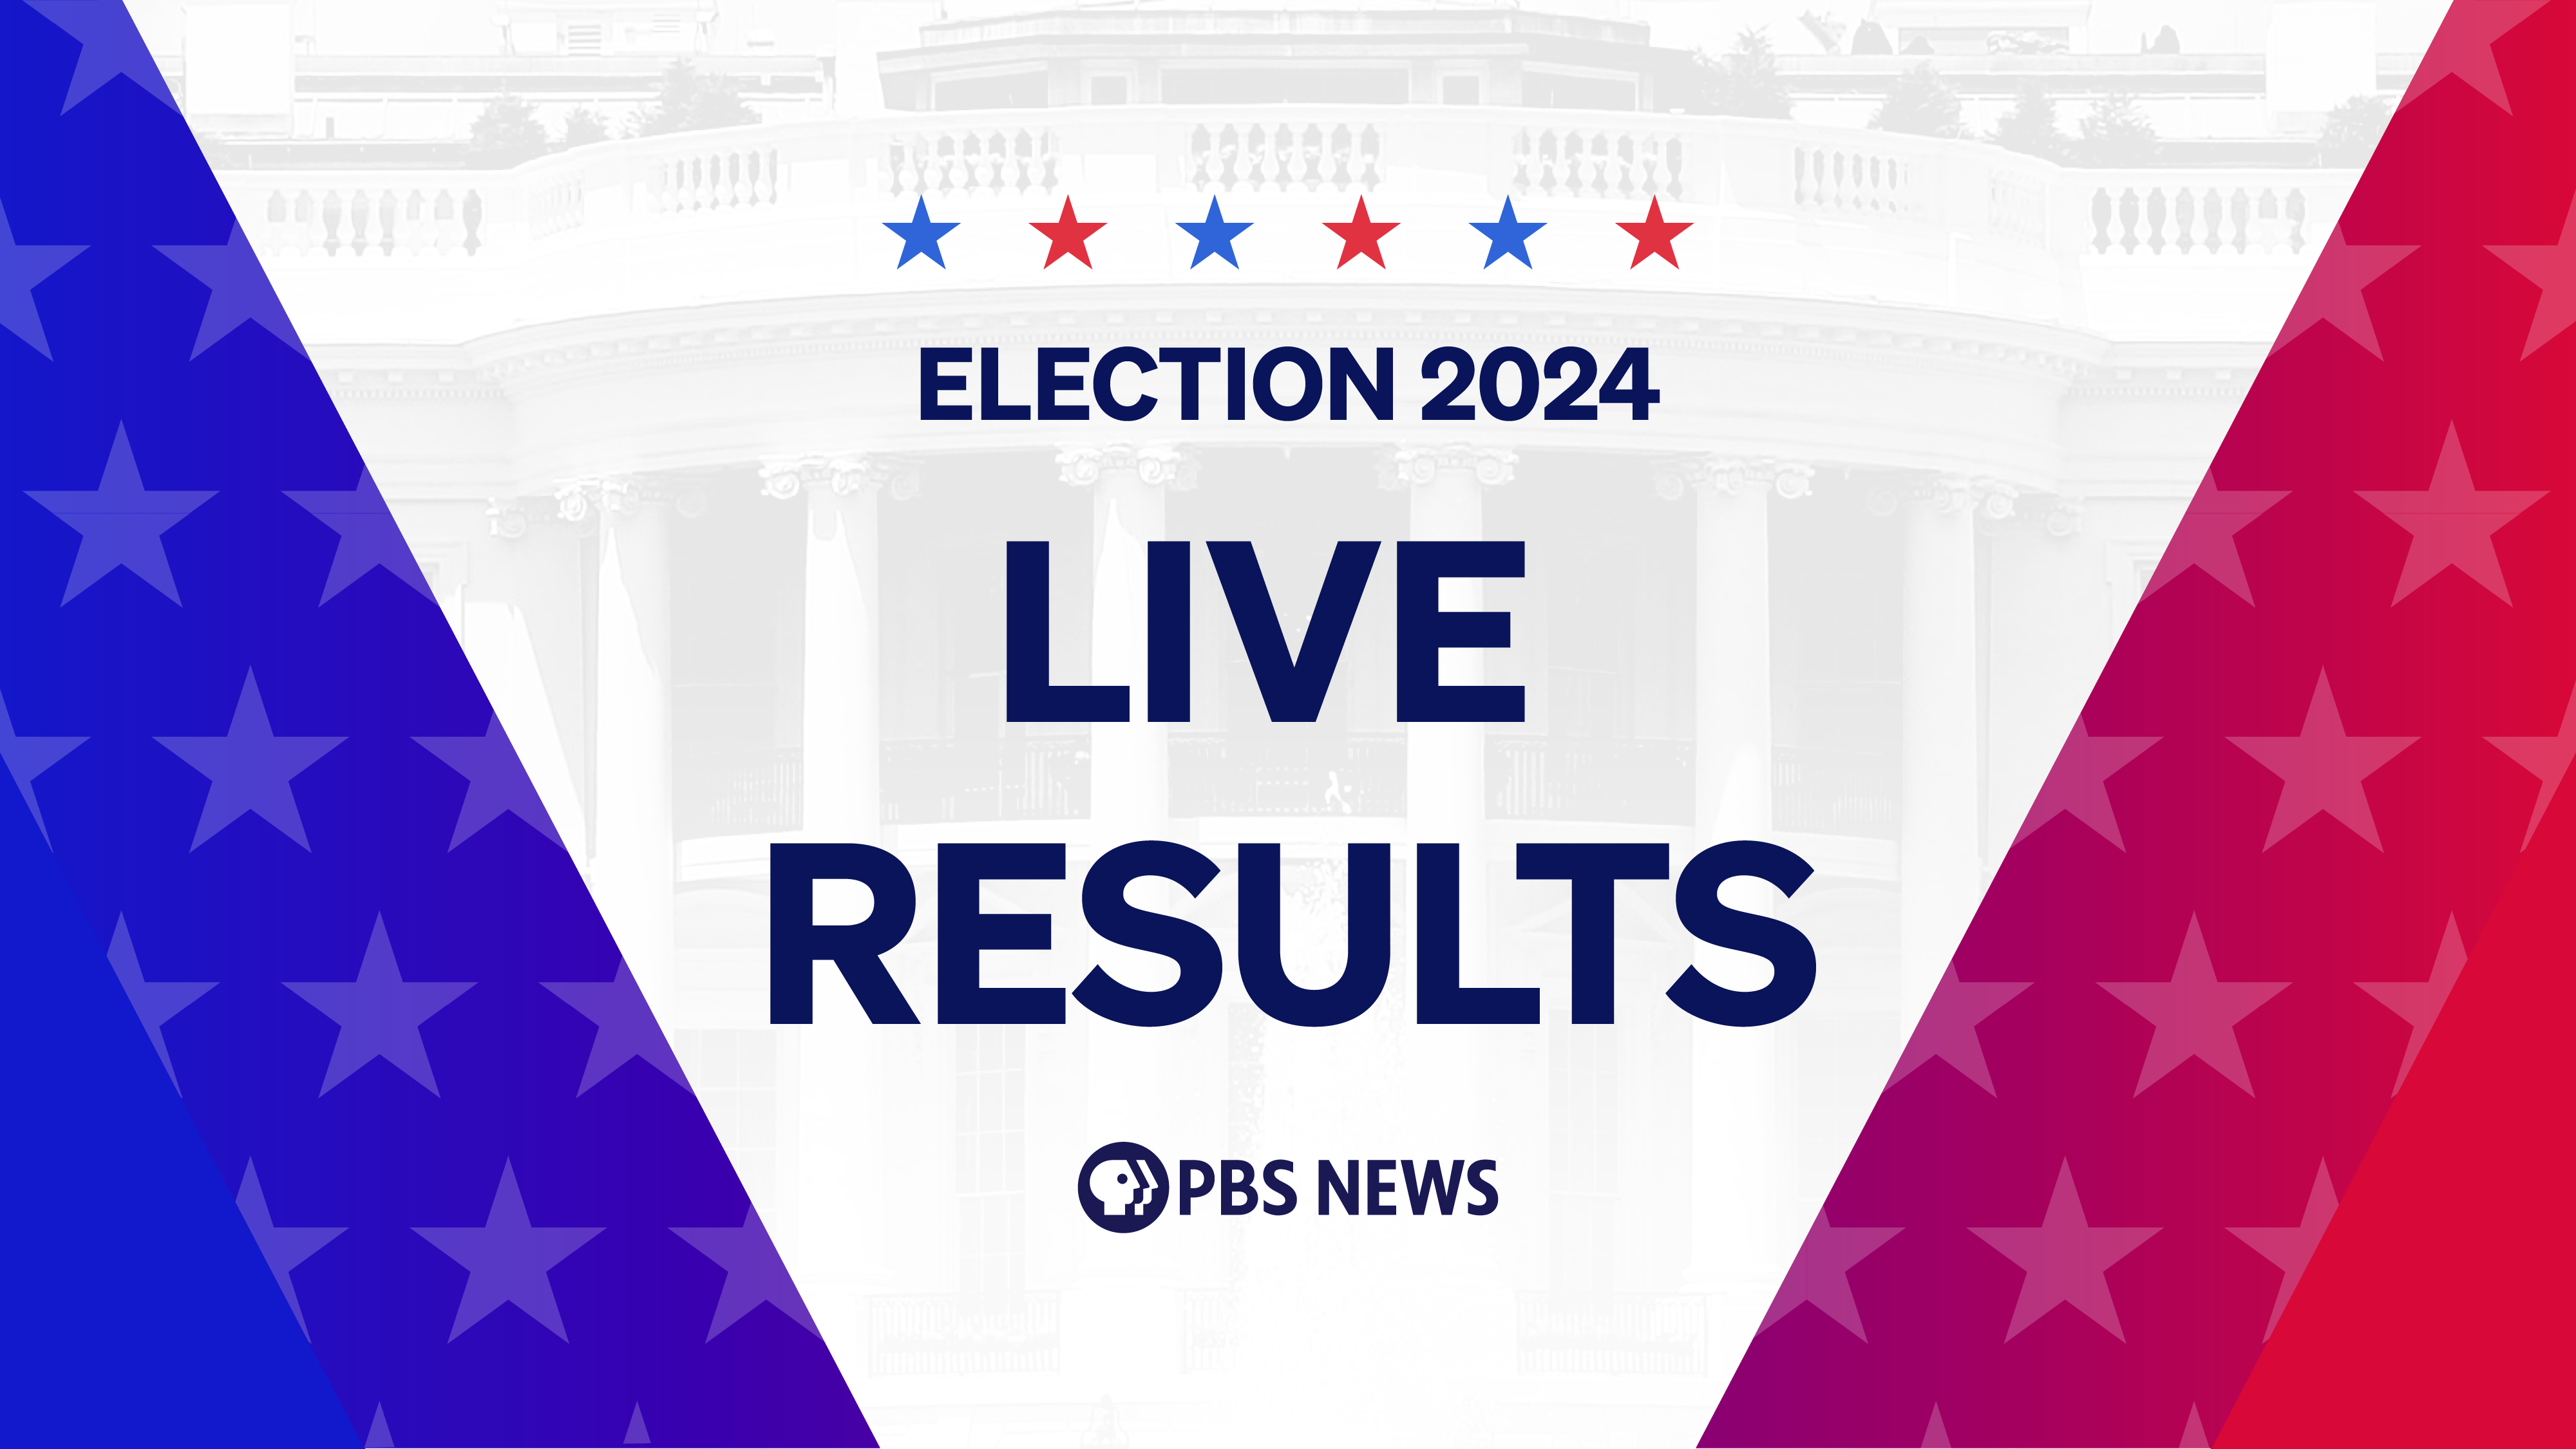
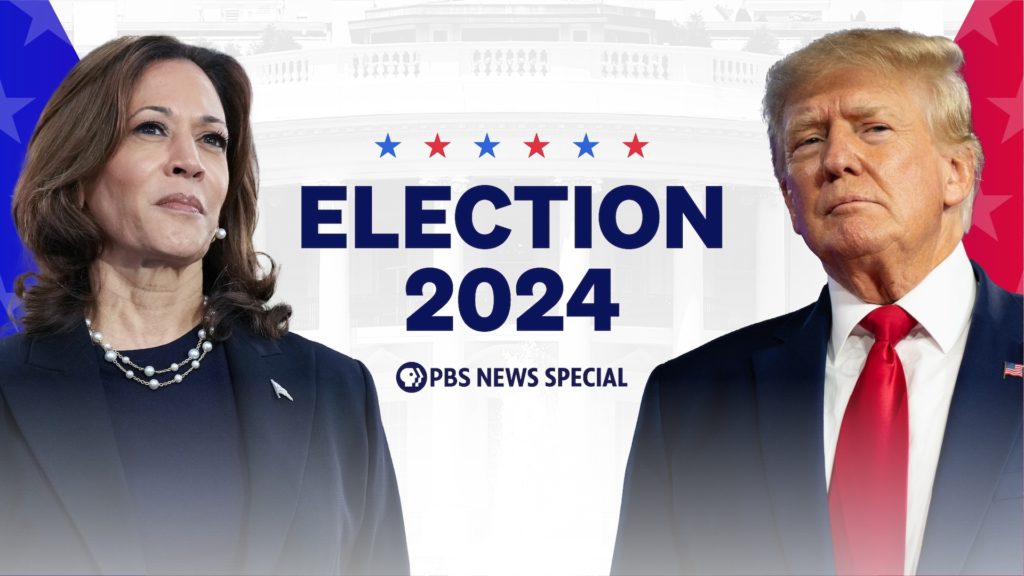
PBS News Website | Election 2024
What I did: Designed and prototyped layouts for site homepage, electoral calculator map and results graphics; collaborated across product, digital, and broadcast teams.
What I used: Figma, WordPress, Associated Press API
PBS News Super Screen | Election 2024
What I did: Designed Super Screen UI; lead production on Super Screen graphics segments before, during & after election special coverage; created bespoke graphics; collaborated across broadcast, creative and engineering teams.
What I used: Figma, Illustrator, TacticDraw, Google Suite, Microsoft Suite
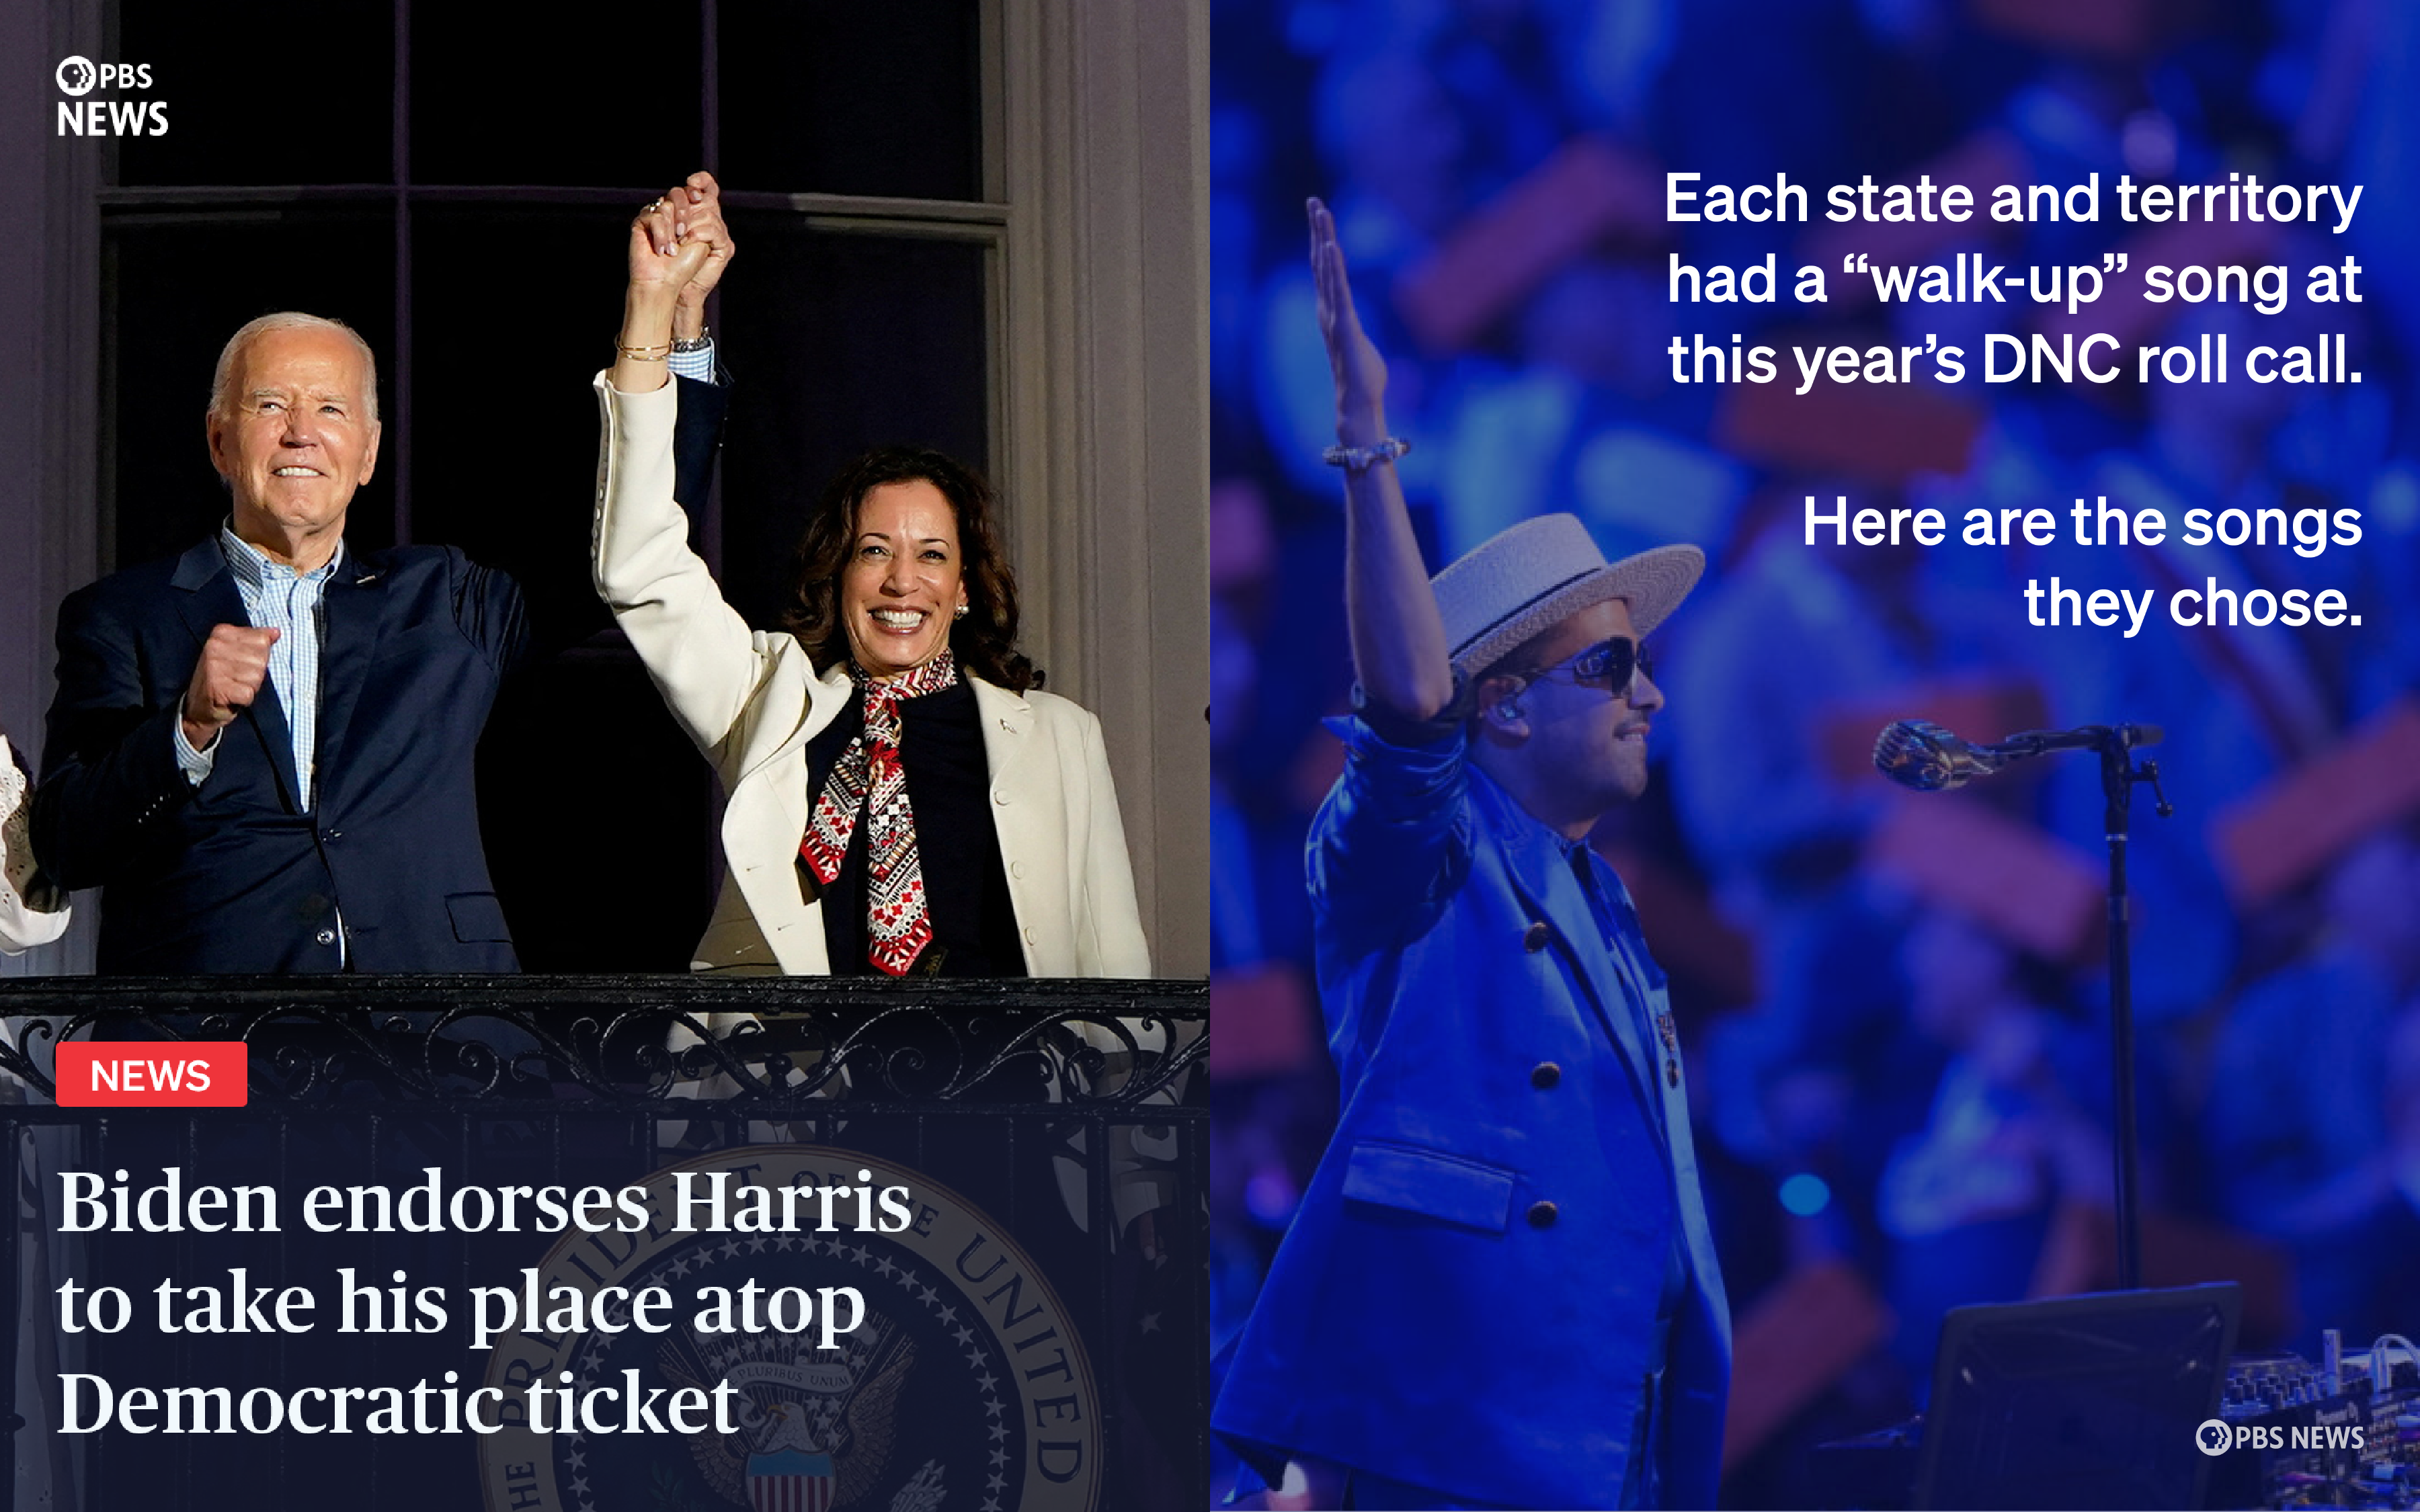
PBS News Graphics Collection
What I did: Produced news graphics for PBS News’ website and social platforms; created and managed graphic templates.
What I used: Illustrator, Photoshop, Figma, OneDrive
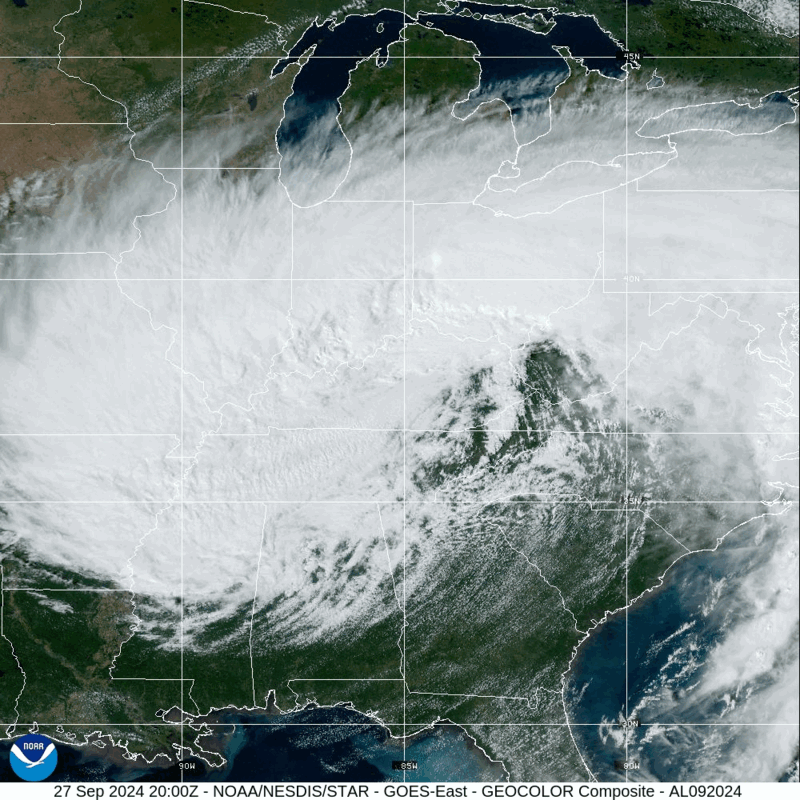
Live Map: Hurricane Helene Tracker
What I did: Built a visualization to display a live storm tracker; kept interactive up-to-date with Associated Press content and NOAA/NWS/NCEP/WPC graphics.
What I used: HTML, WordPress, Photoshop

Dengue Fever
What I did: Visualized data on dengue fever cases in the Americas since 1980.
What I used: Datawrapper, HTML, WordPress
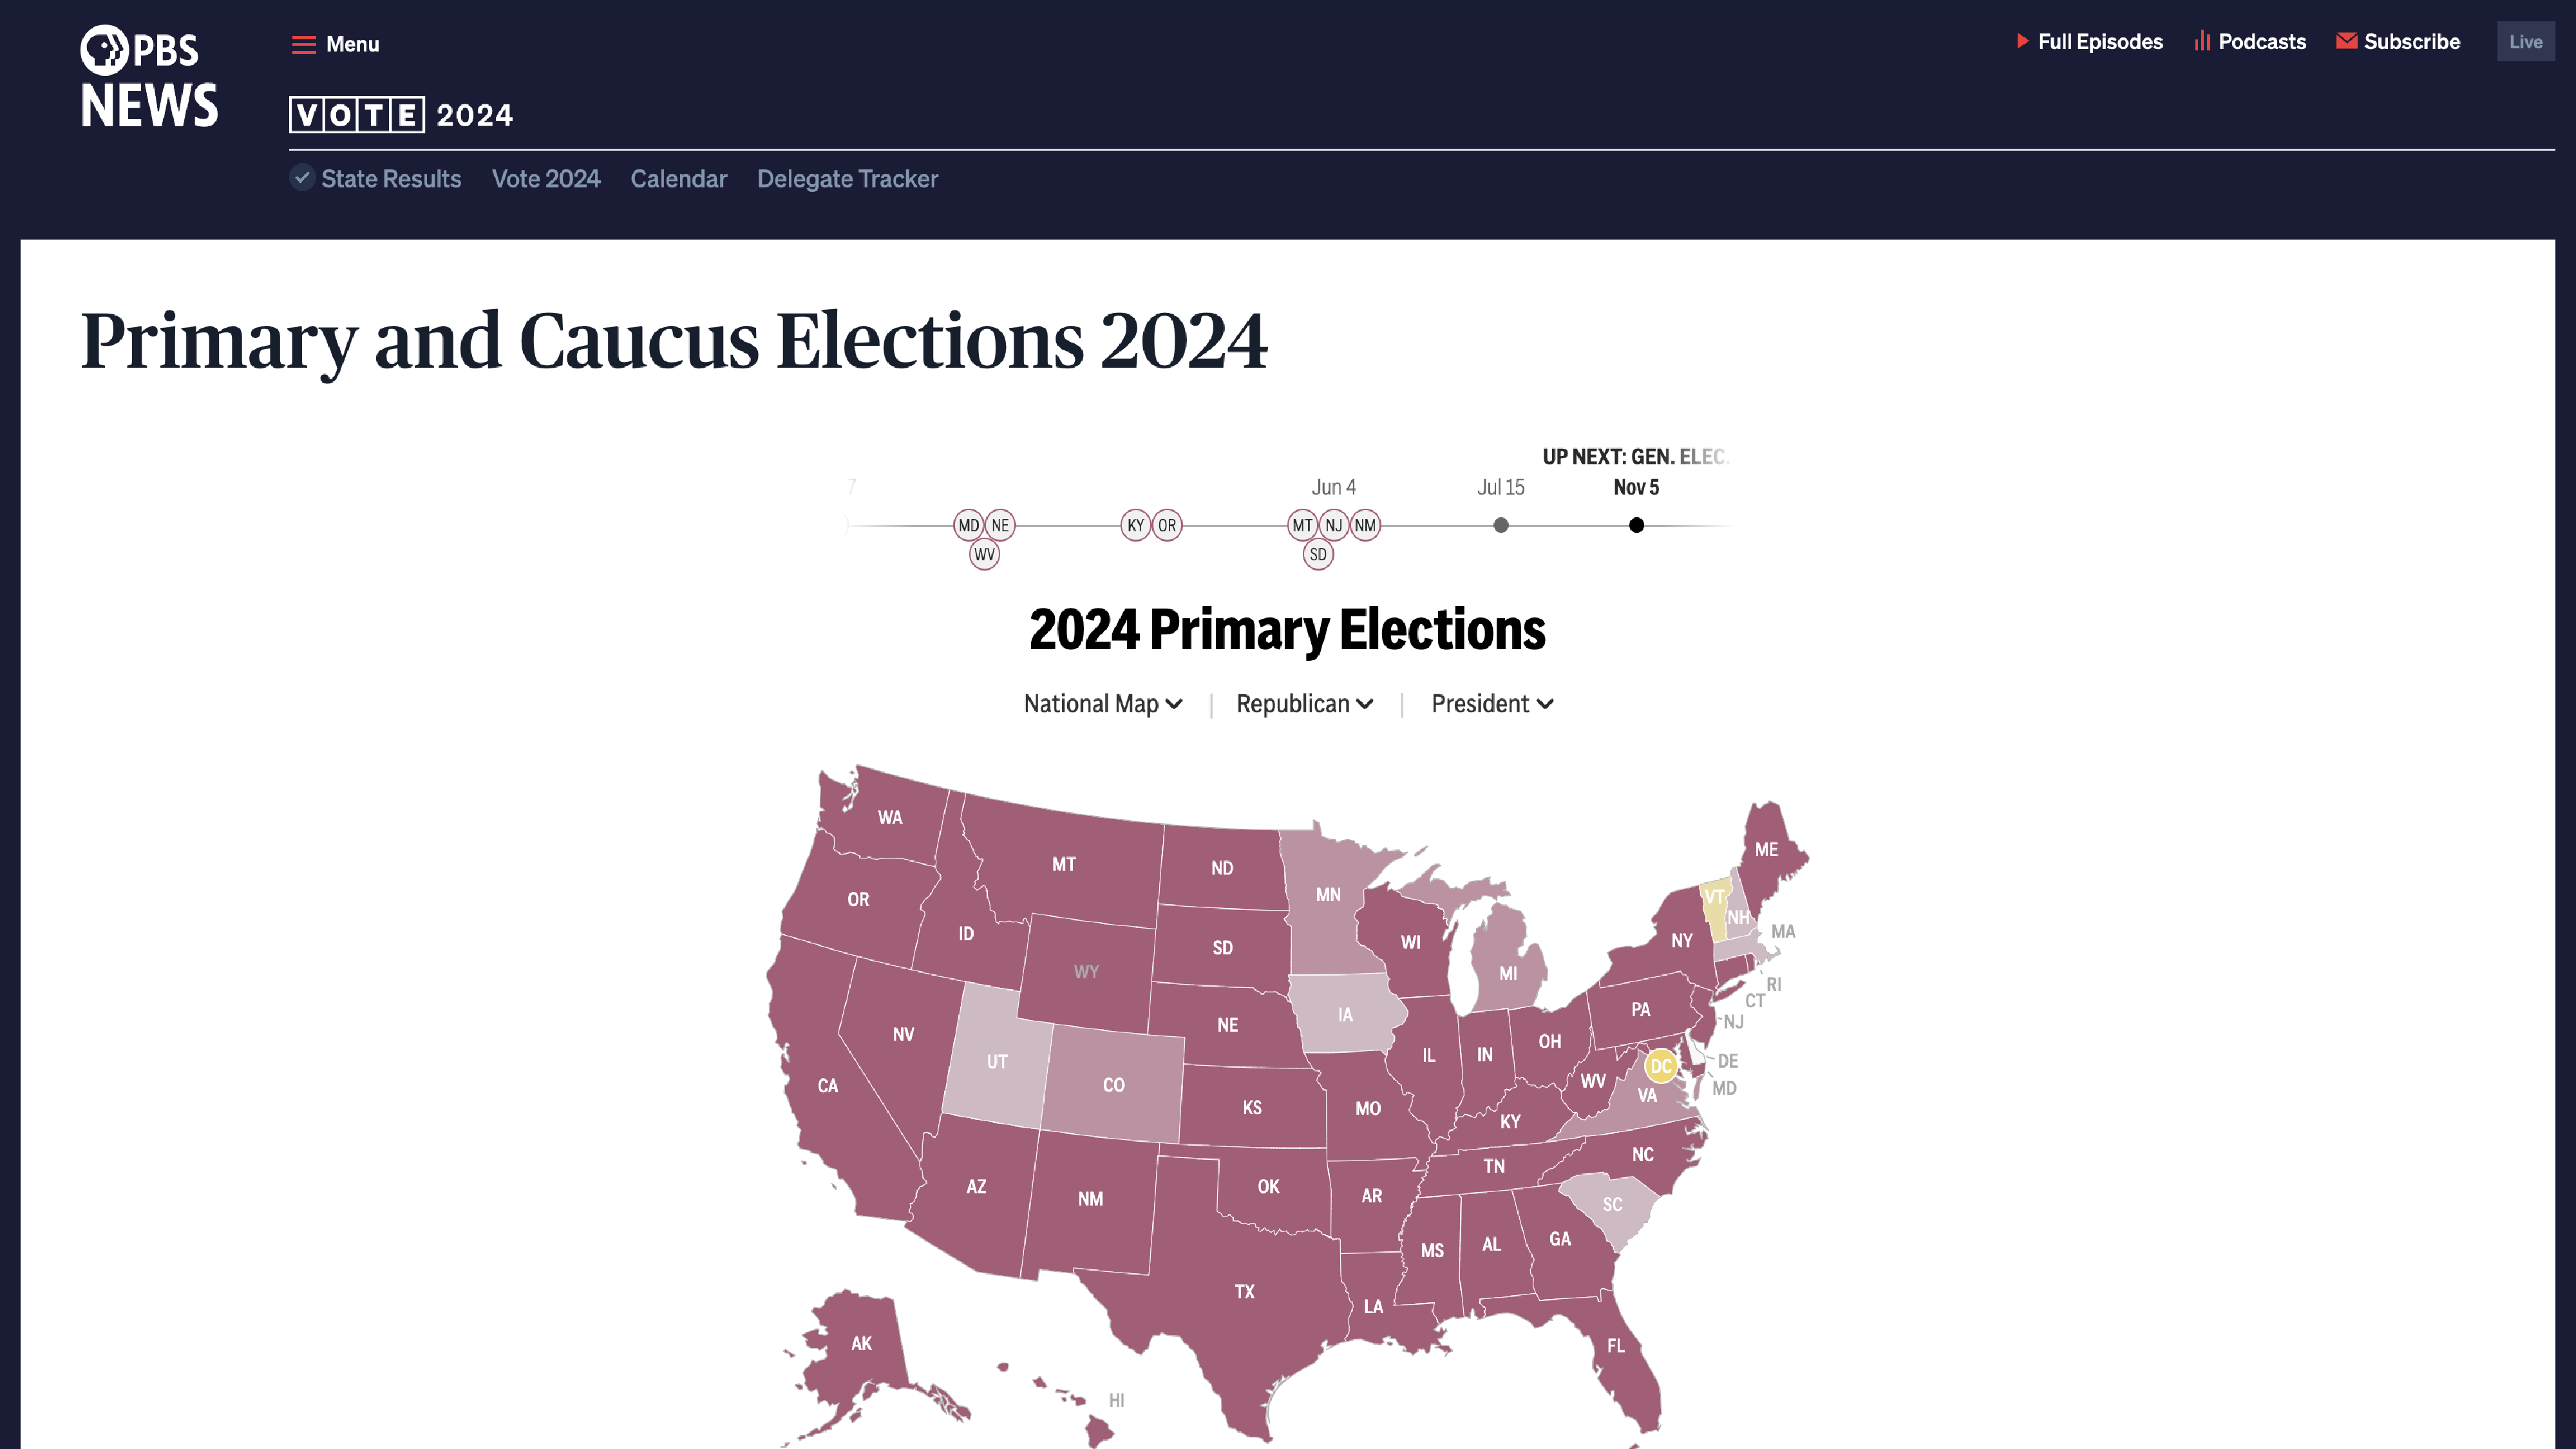
2024 Primary and Caucus Elections
What I did: Wireframed and prototyped pages to host Associated Press graphics for live national and state election results, a delegate tracker, a 2024 election calendar, and all election-related stories; collaborated with the social team to produce winner graphics after race calls.
What I used: Figma, WordPress, Illustrator, HTML, GitHub
How many book bans were attempted in your state?
What I did: Co-authored story on book bans in the U.S.; visualized data on restricted books.
What I used: Flourish, Illustrator, WordPress
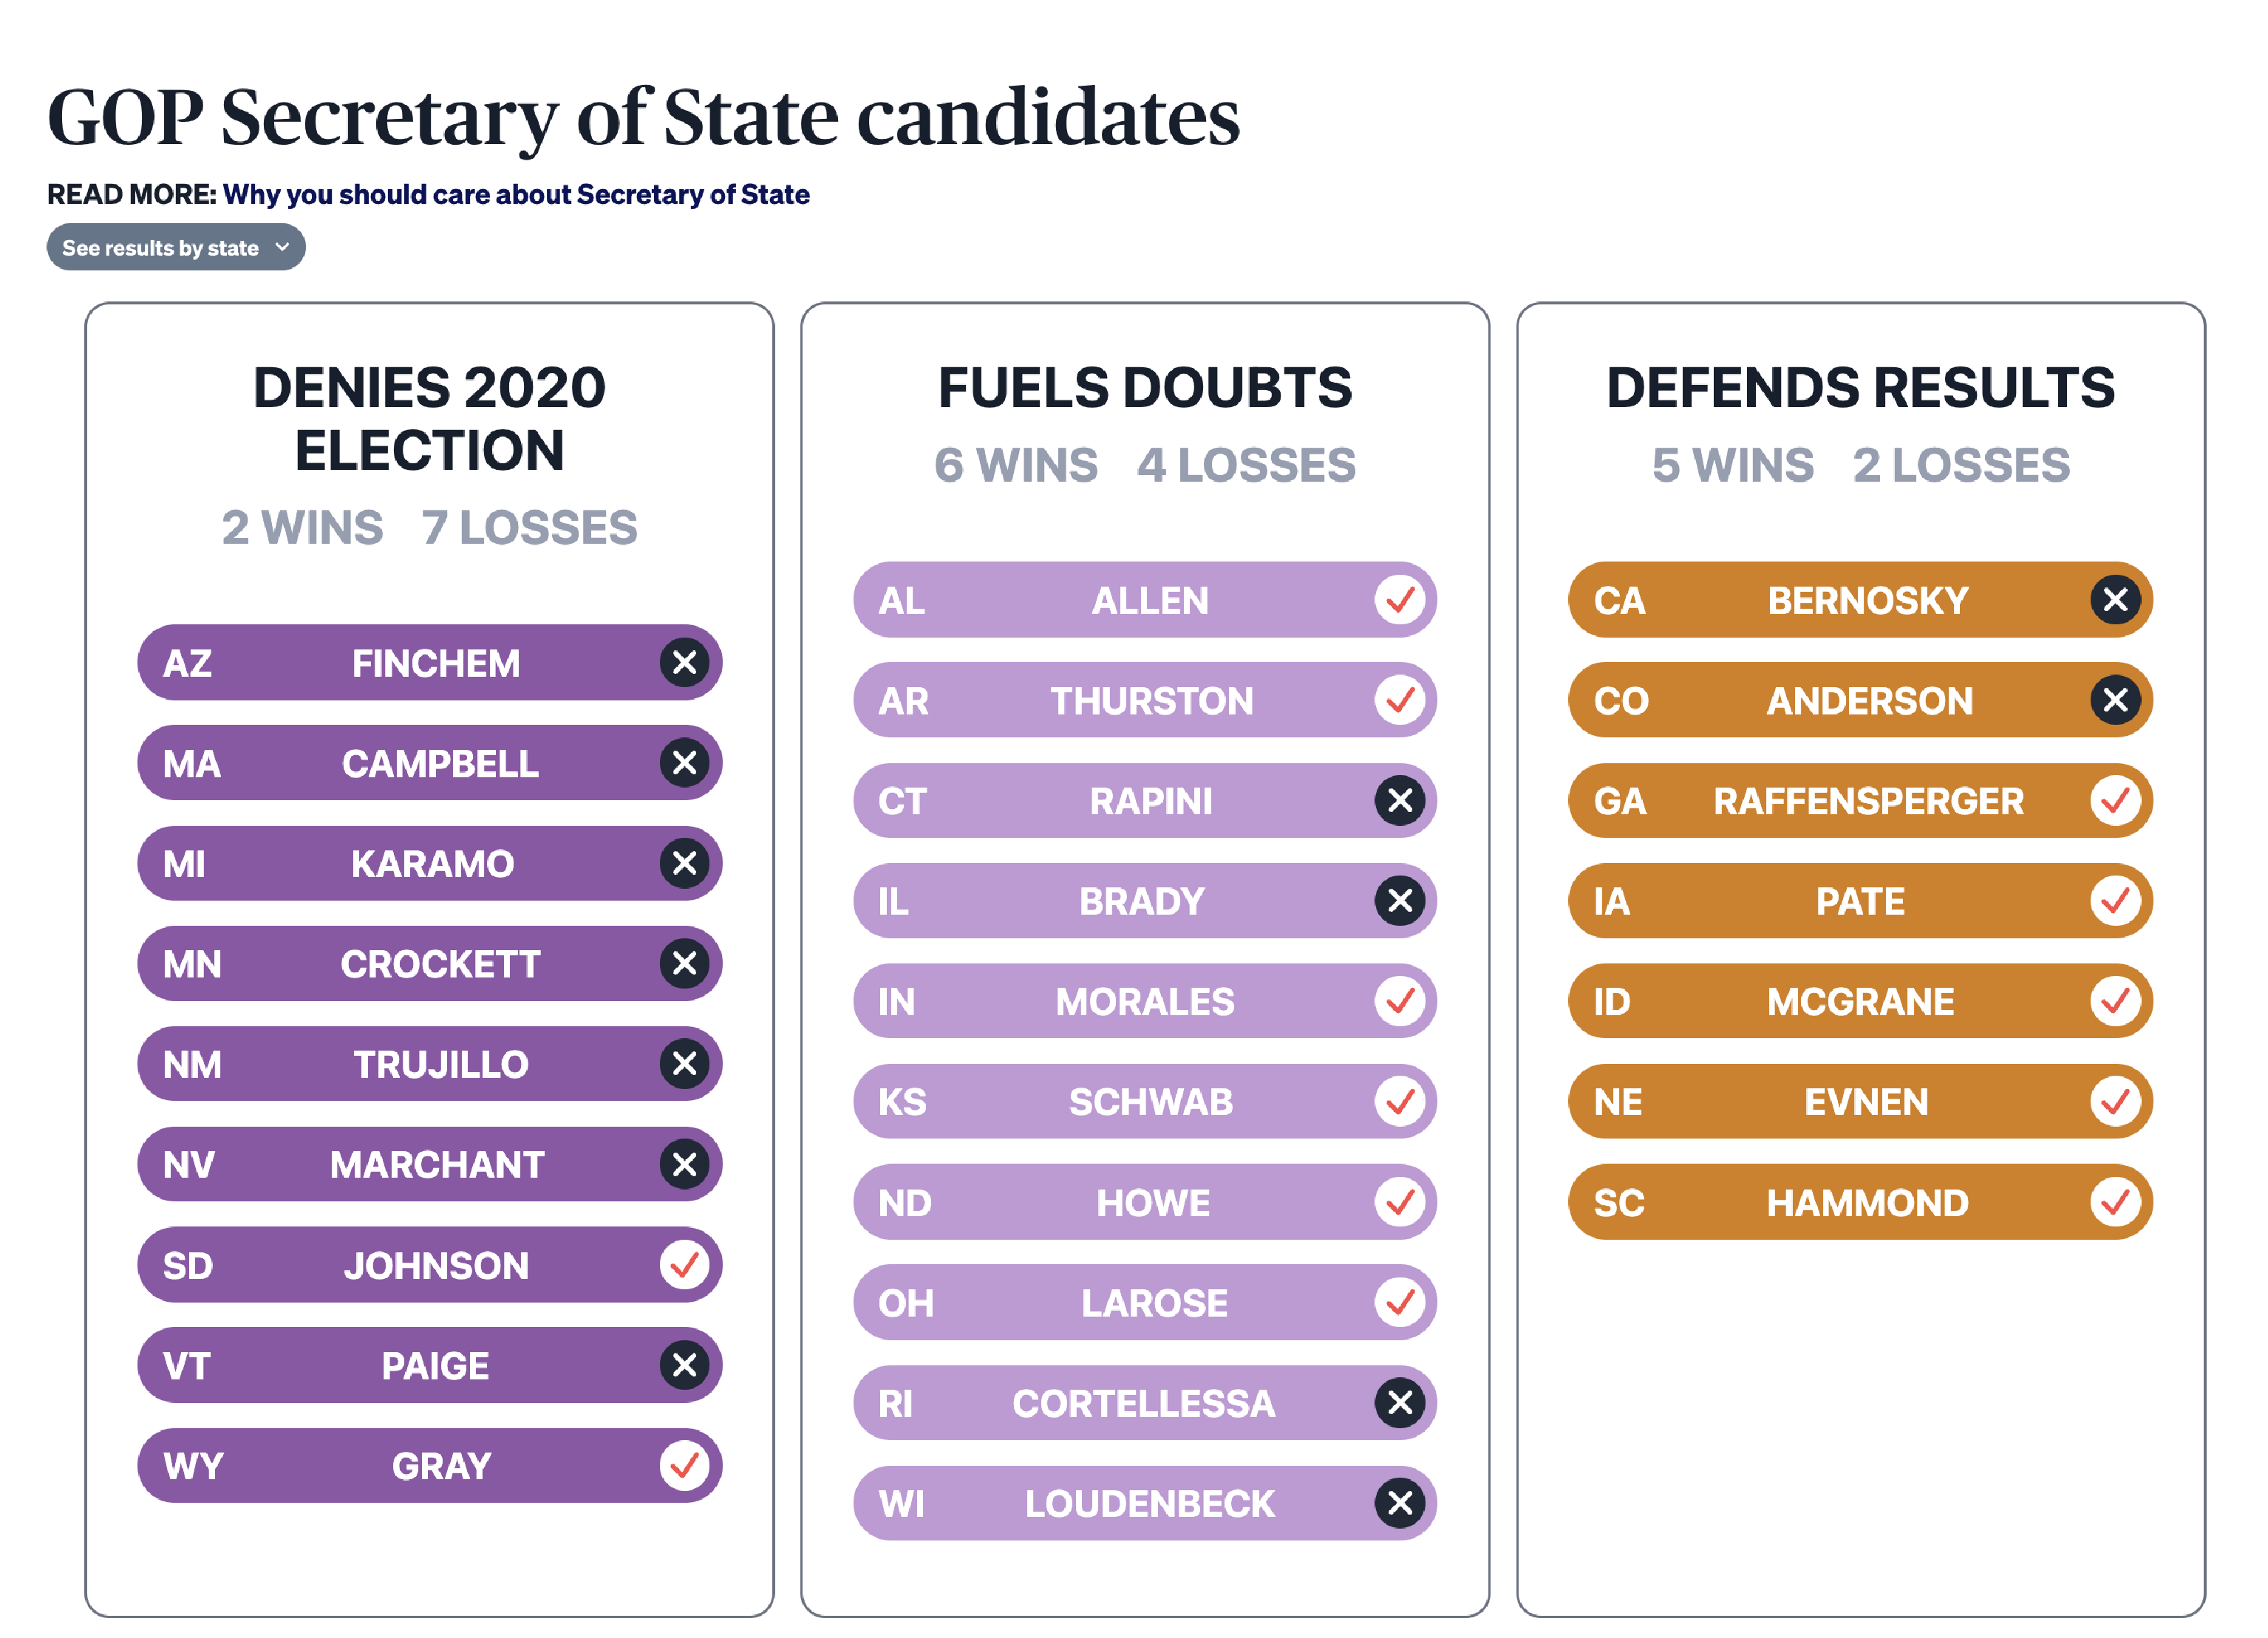
2022 Midterm Election Coverage
What I did: Designed the election denier tracker (classifying figures as deniers, doubters, or defenders); co-authored an election guide newsletter; wrote two data-driven stories on the role of secretaries of state in elections and how our map can identify who runs elections in your state.
What I used: Datawrapper, Figma, Illustrator, Mailchimp, WordPress

South Dakota Medicaid Expansion
What I did: Designed the page layout for enterprise story; visualized data on medicaid coverage gap and maternal care deserts; hired and coordinated local photographer to travel with reporter and photograph subjects.
What I used: Datawrapper, Figma, Illustrator, WordPress
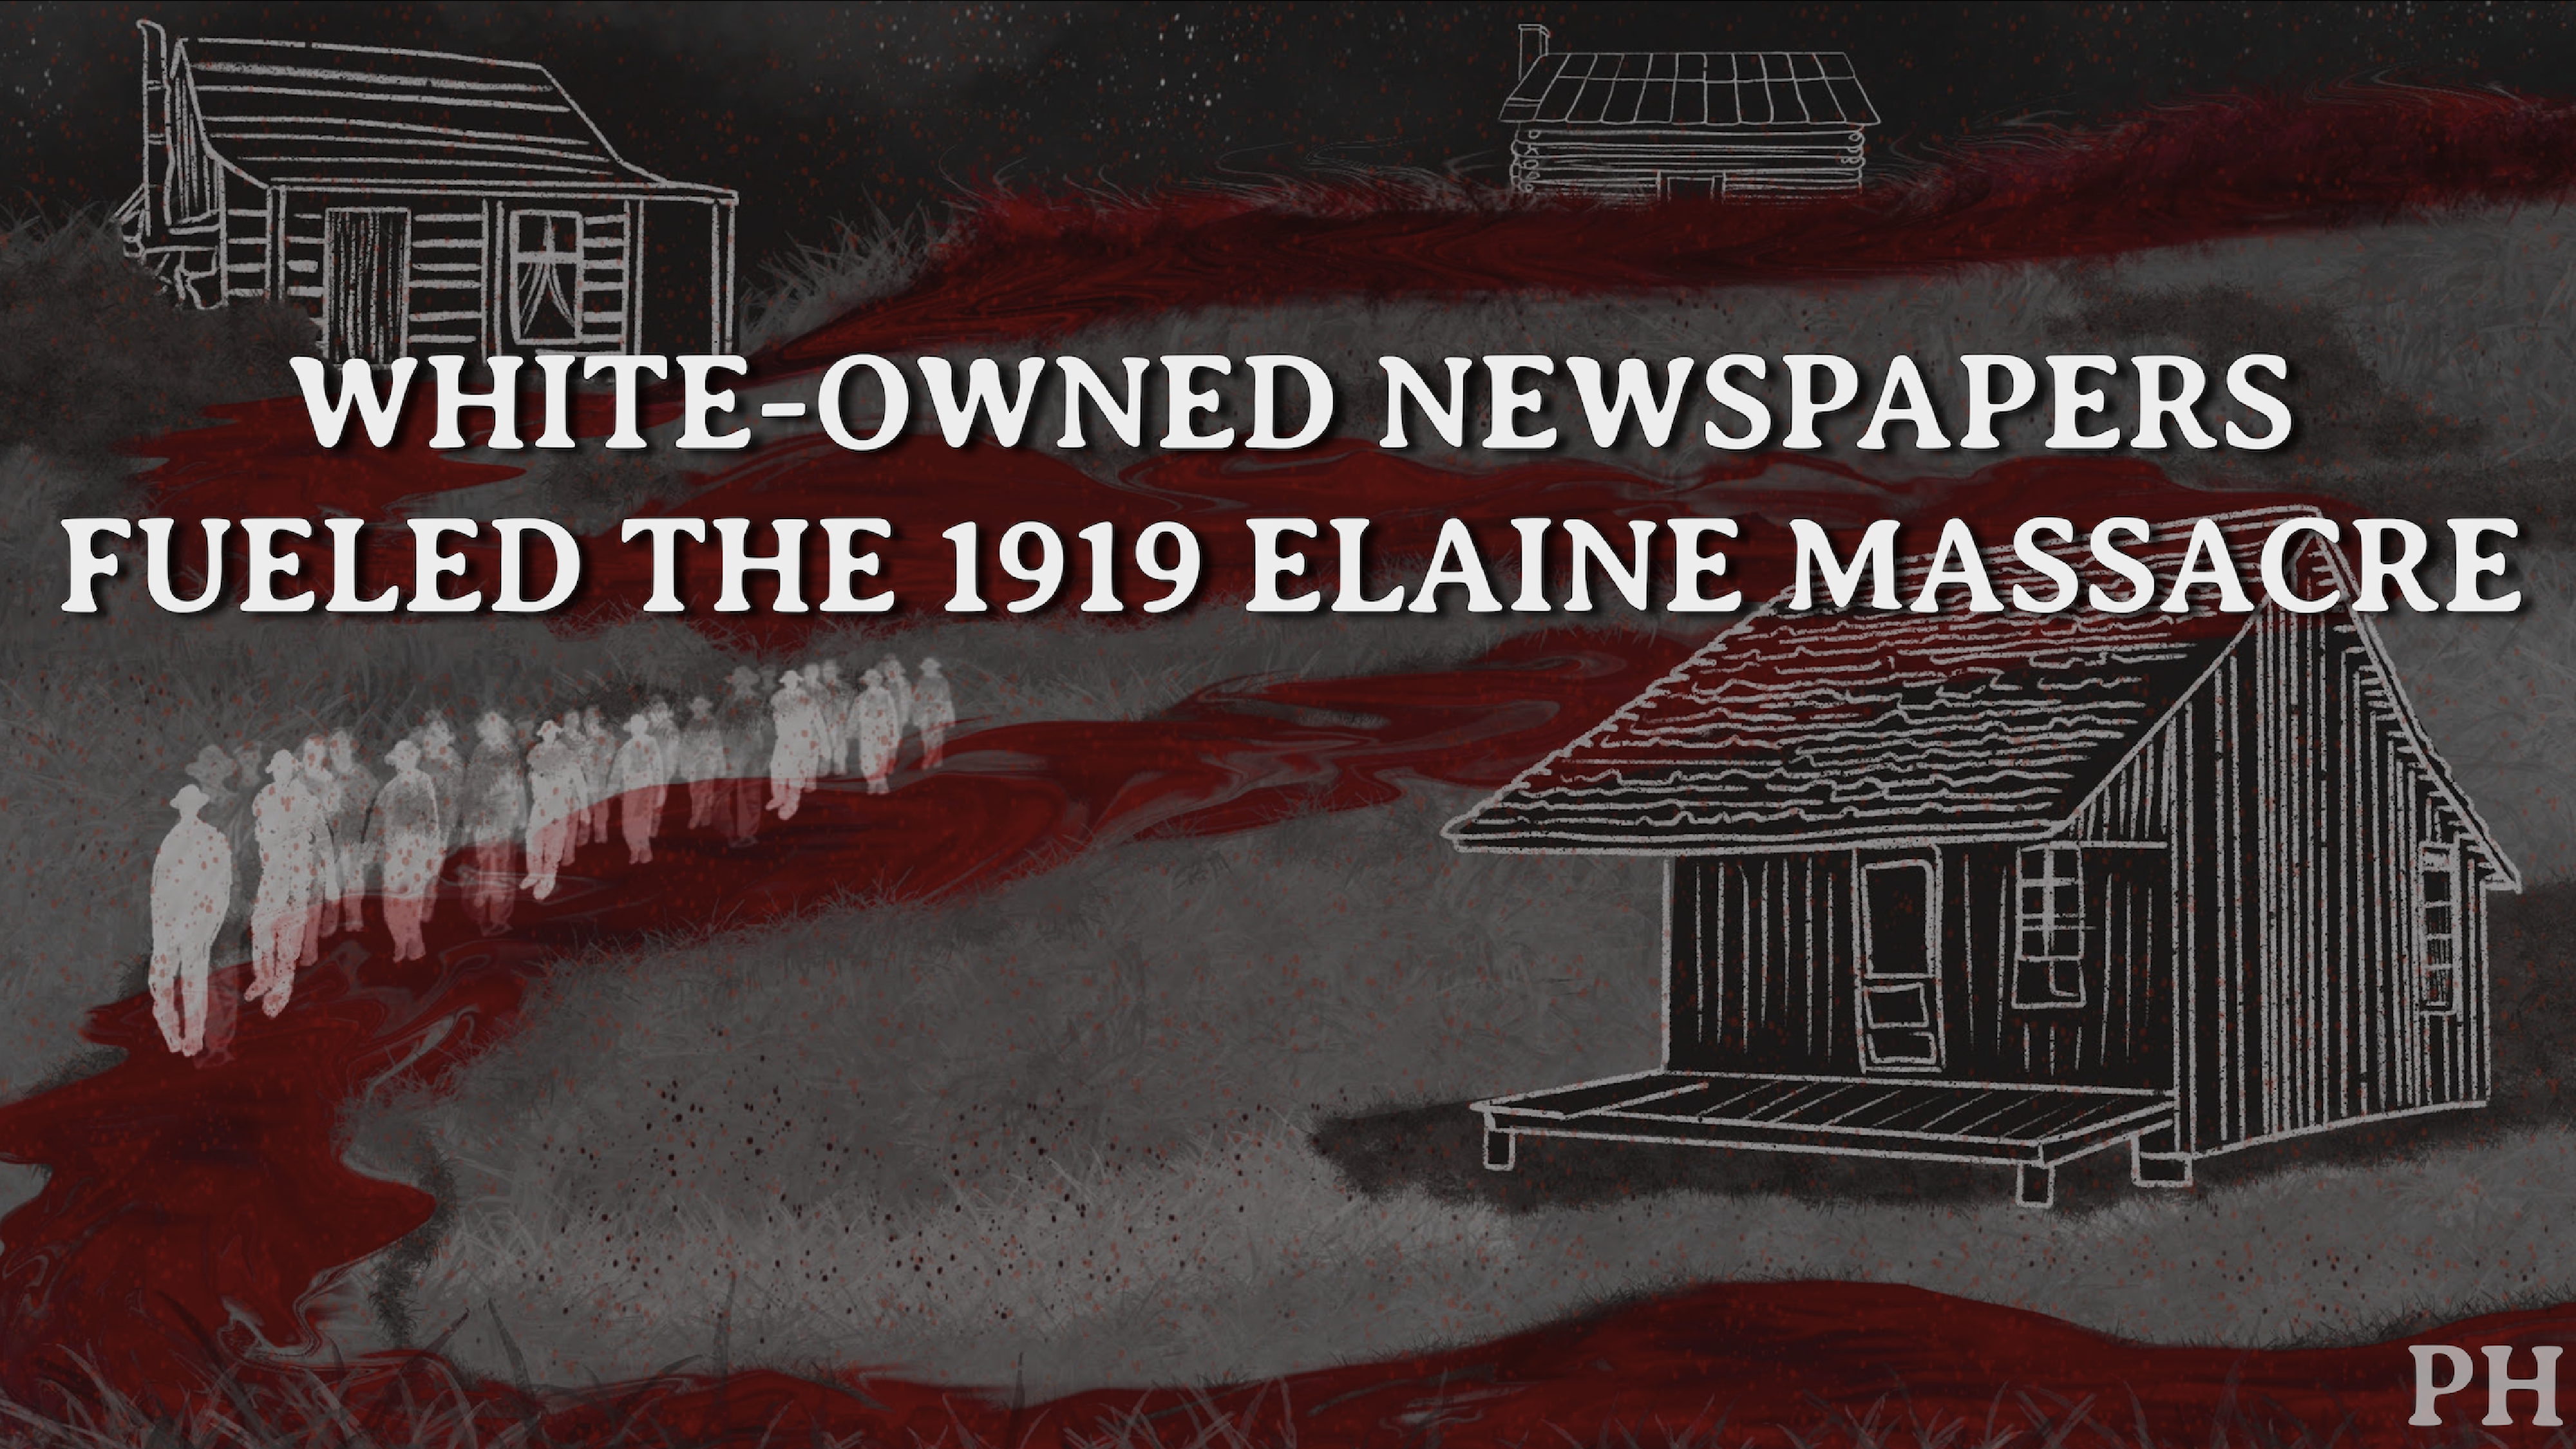
Elaine Massacre Mini Documentary
What I did: Integrated archival materials, custom illustrations, audio and video interviews, data visualizations, and motion graphics into a cohesive mini-documentary.
What I used: After Effects, Premiere, Illustrator, Photoshop, Procreate, Carto, Datawrapper
Awards: SPJ Best Use of Multimedia, Festival of Media Arts Award of Excellence
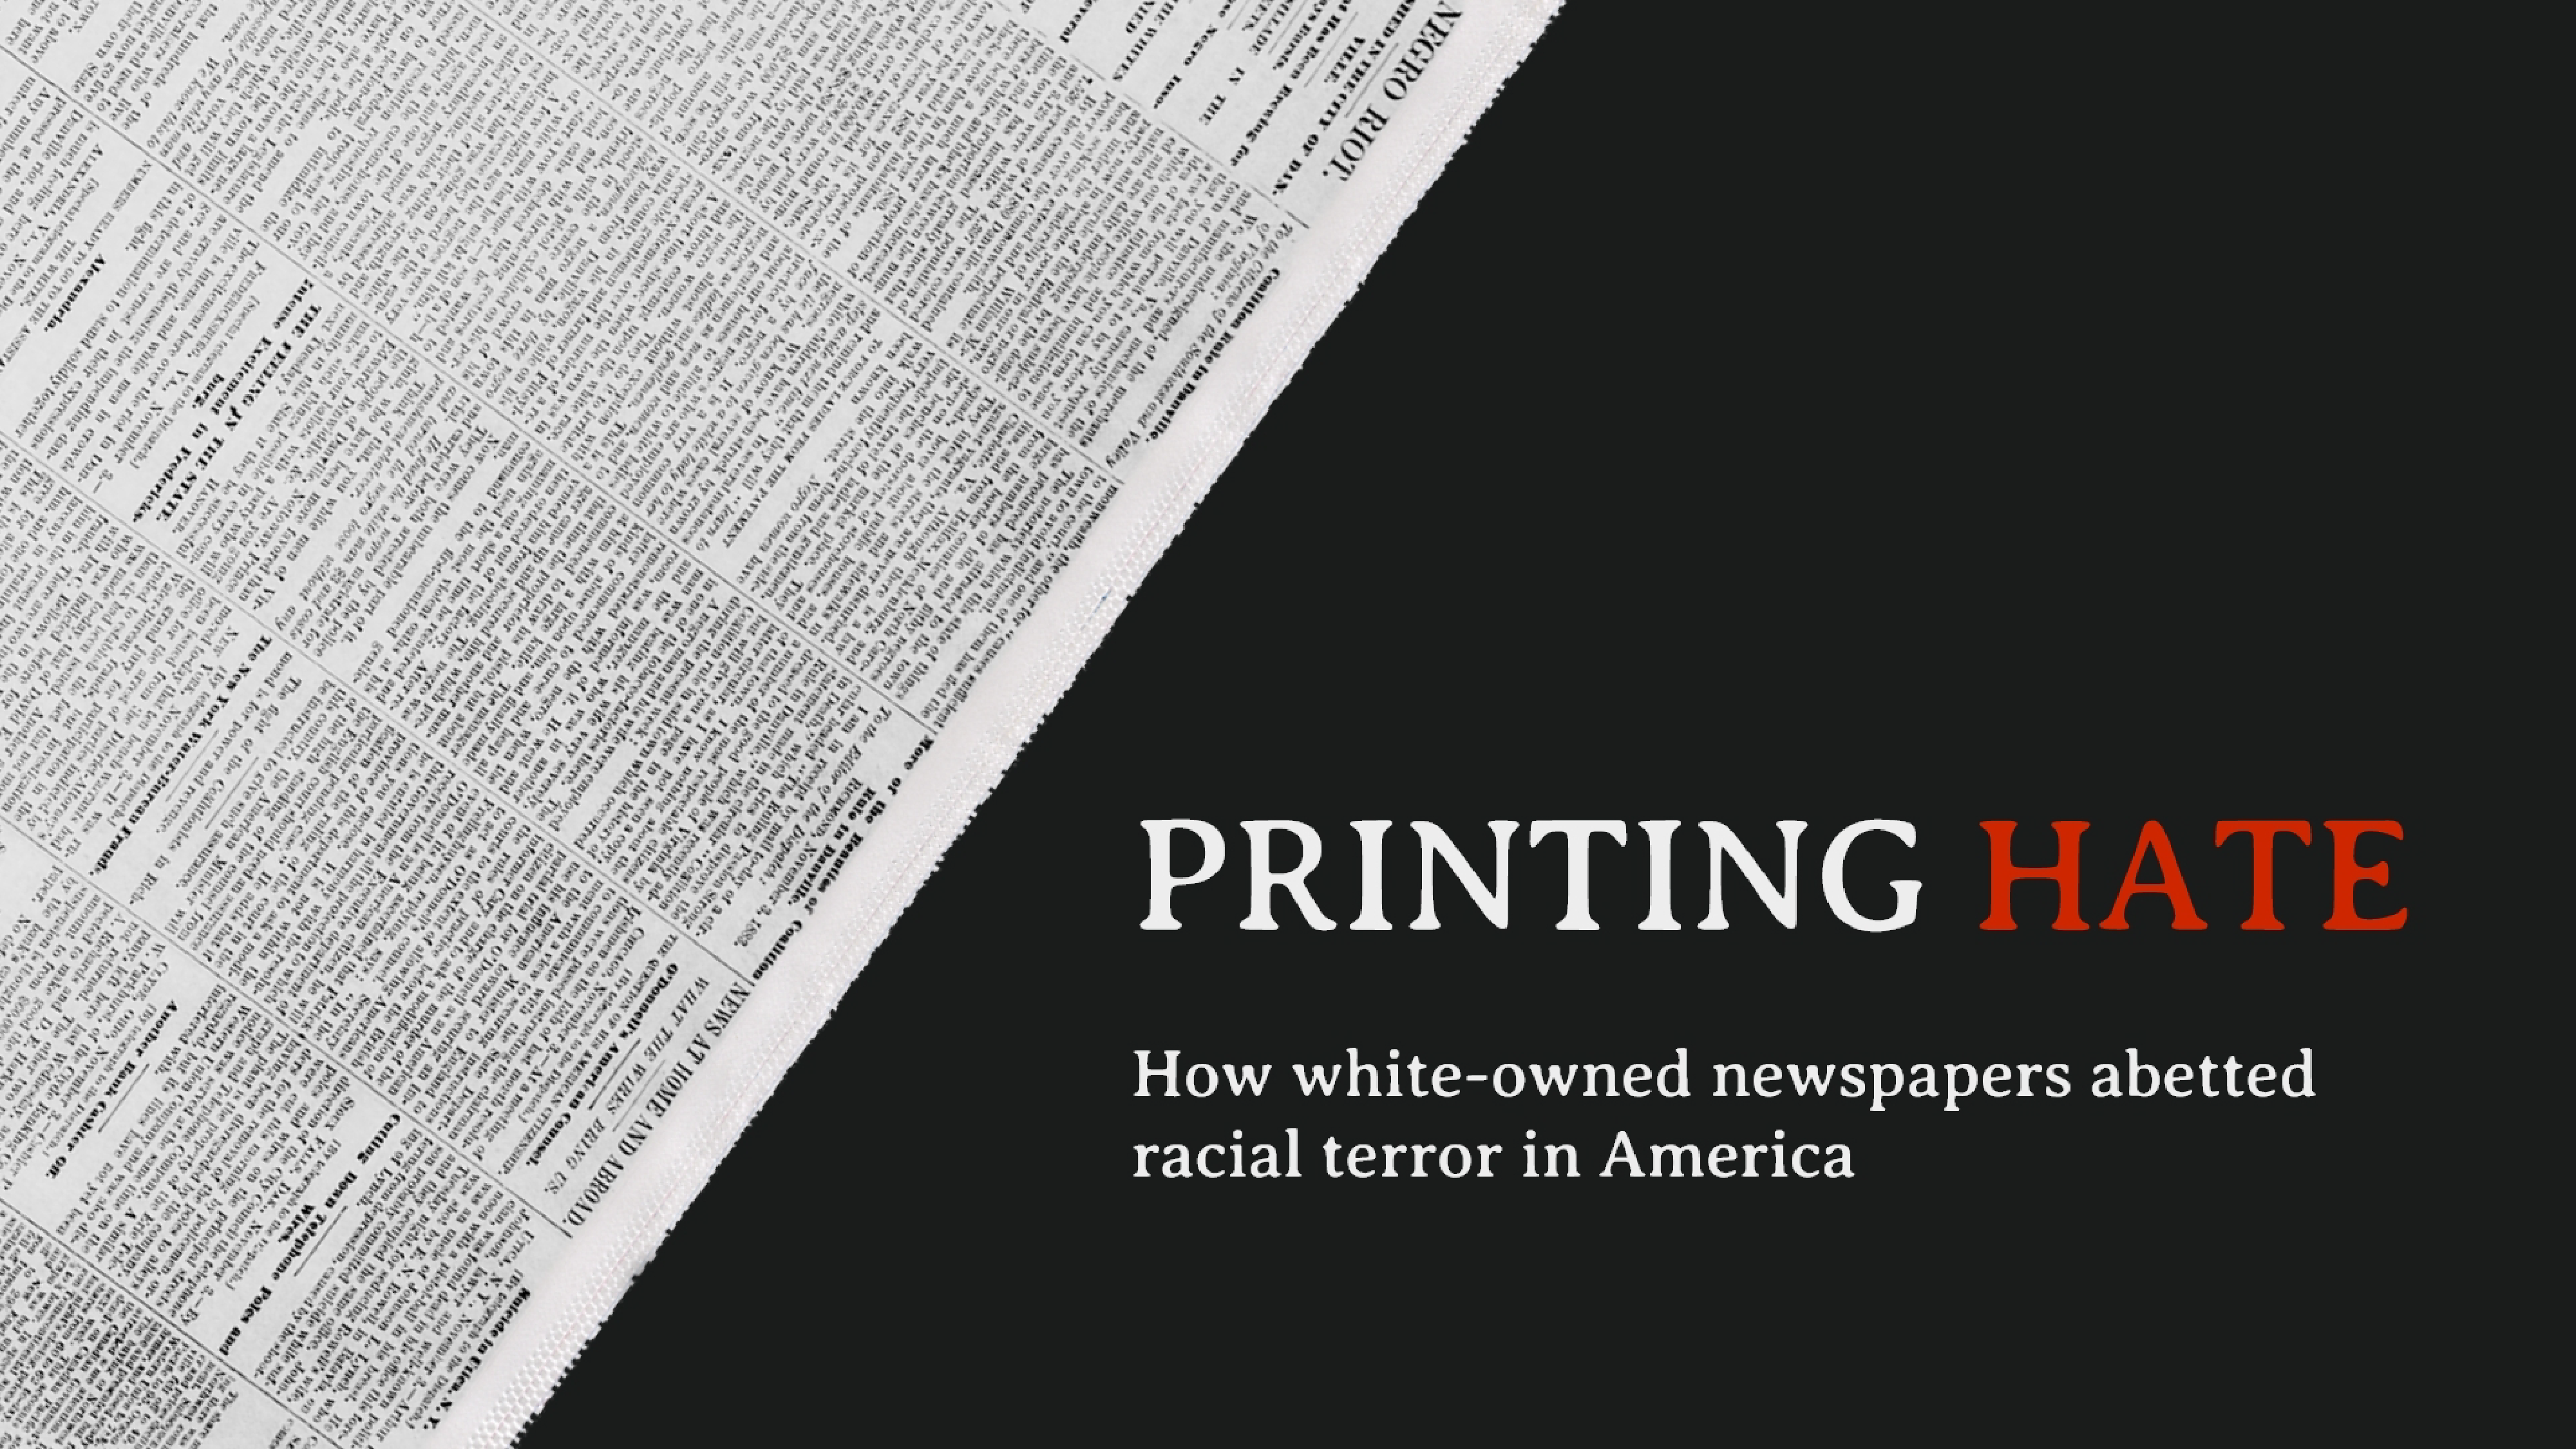
Printing Hate Website
What I did: Designed project branding and developed the site infrastructure.
What I used: HTML, CSS, WordPress, XD, Illustrator, Photoshop
Awards: Online Journalism Award, IRE Medal, NLA Innovator of the Year, SPJ Award for Collaborative Journalism
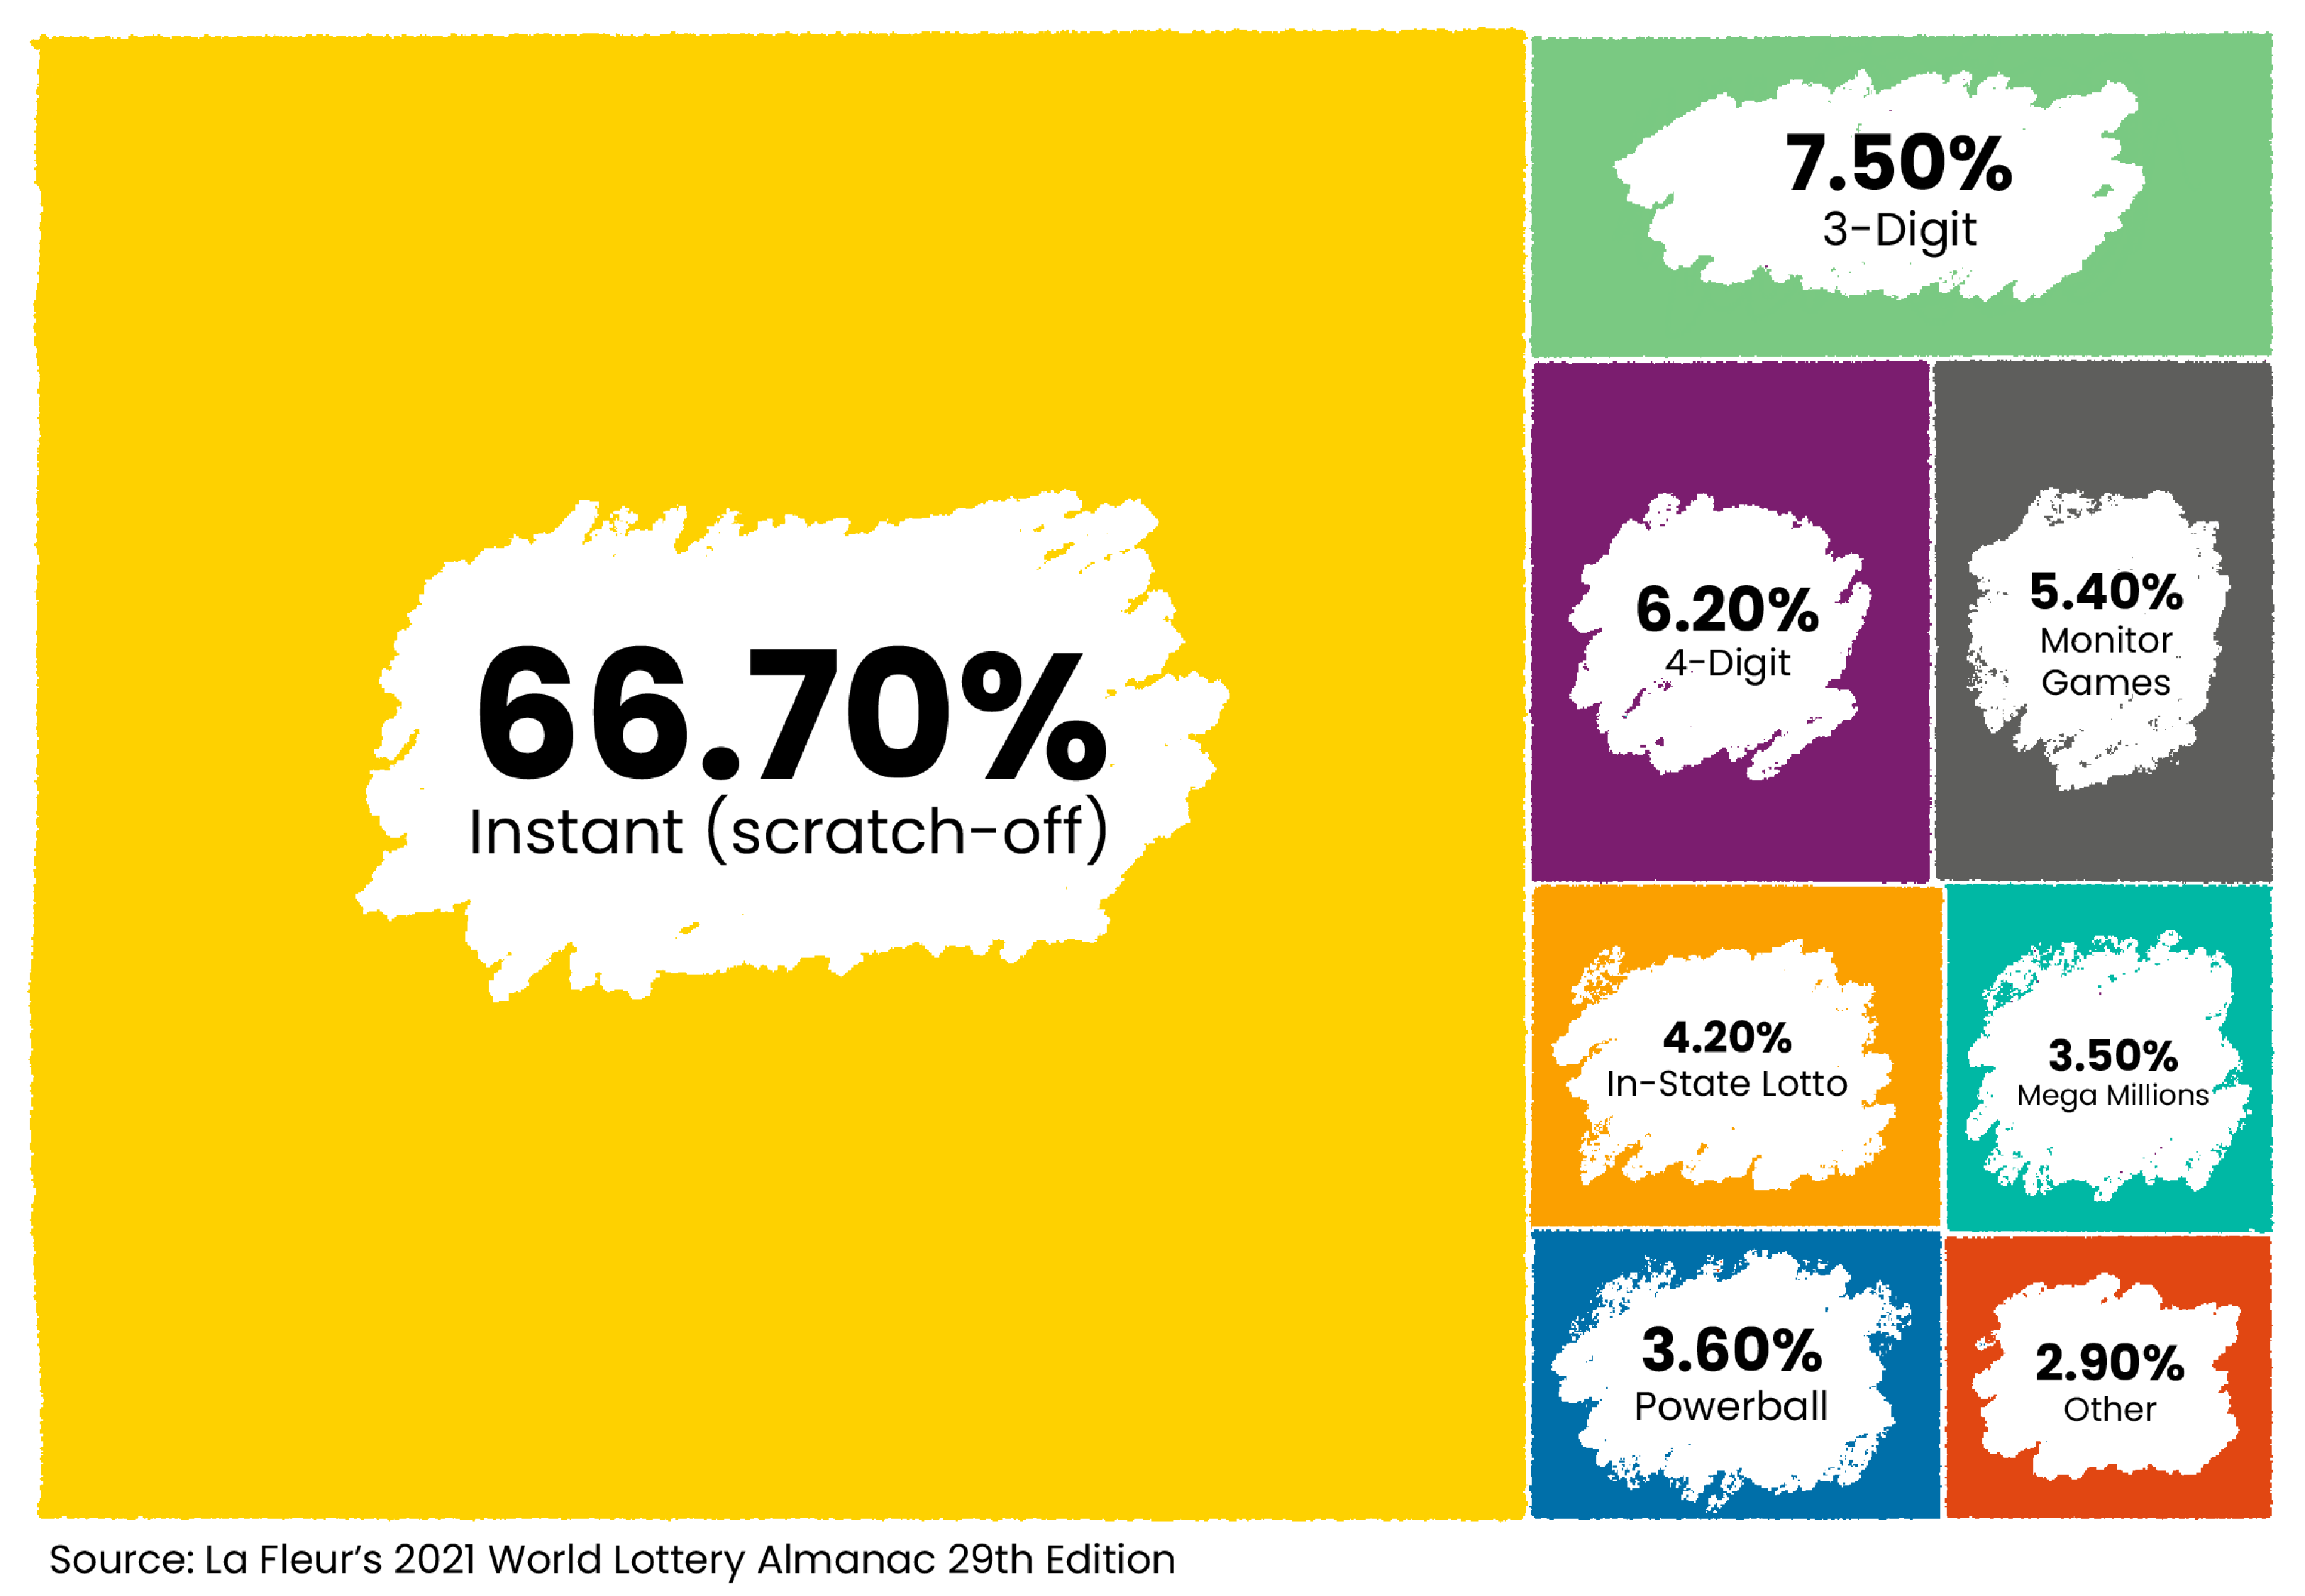
Mega Billions Data Visualizations
What I did: Created visualizations on the history of lotteries and the most popular types of lottery games.
What I used: Datawrapper, Illustrator, Procreate
Goucher Poll Quiz
What I did: Illustrated images to accompany each poll question.
What I used: Illustrator, Photoshop, Procreate
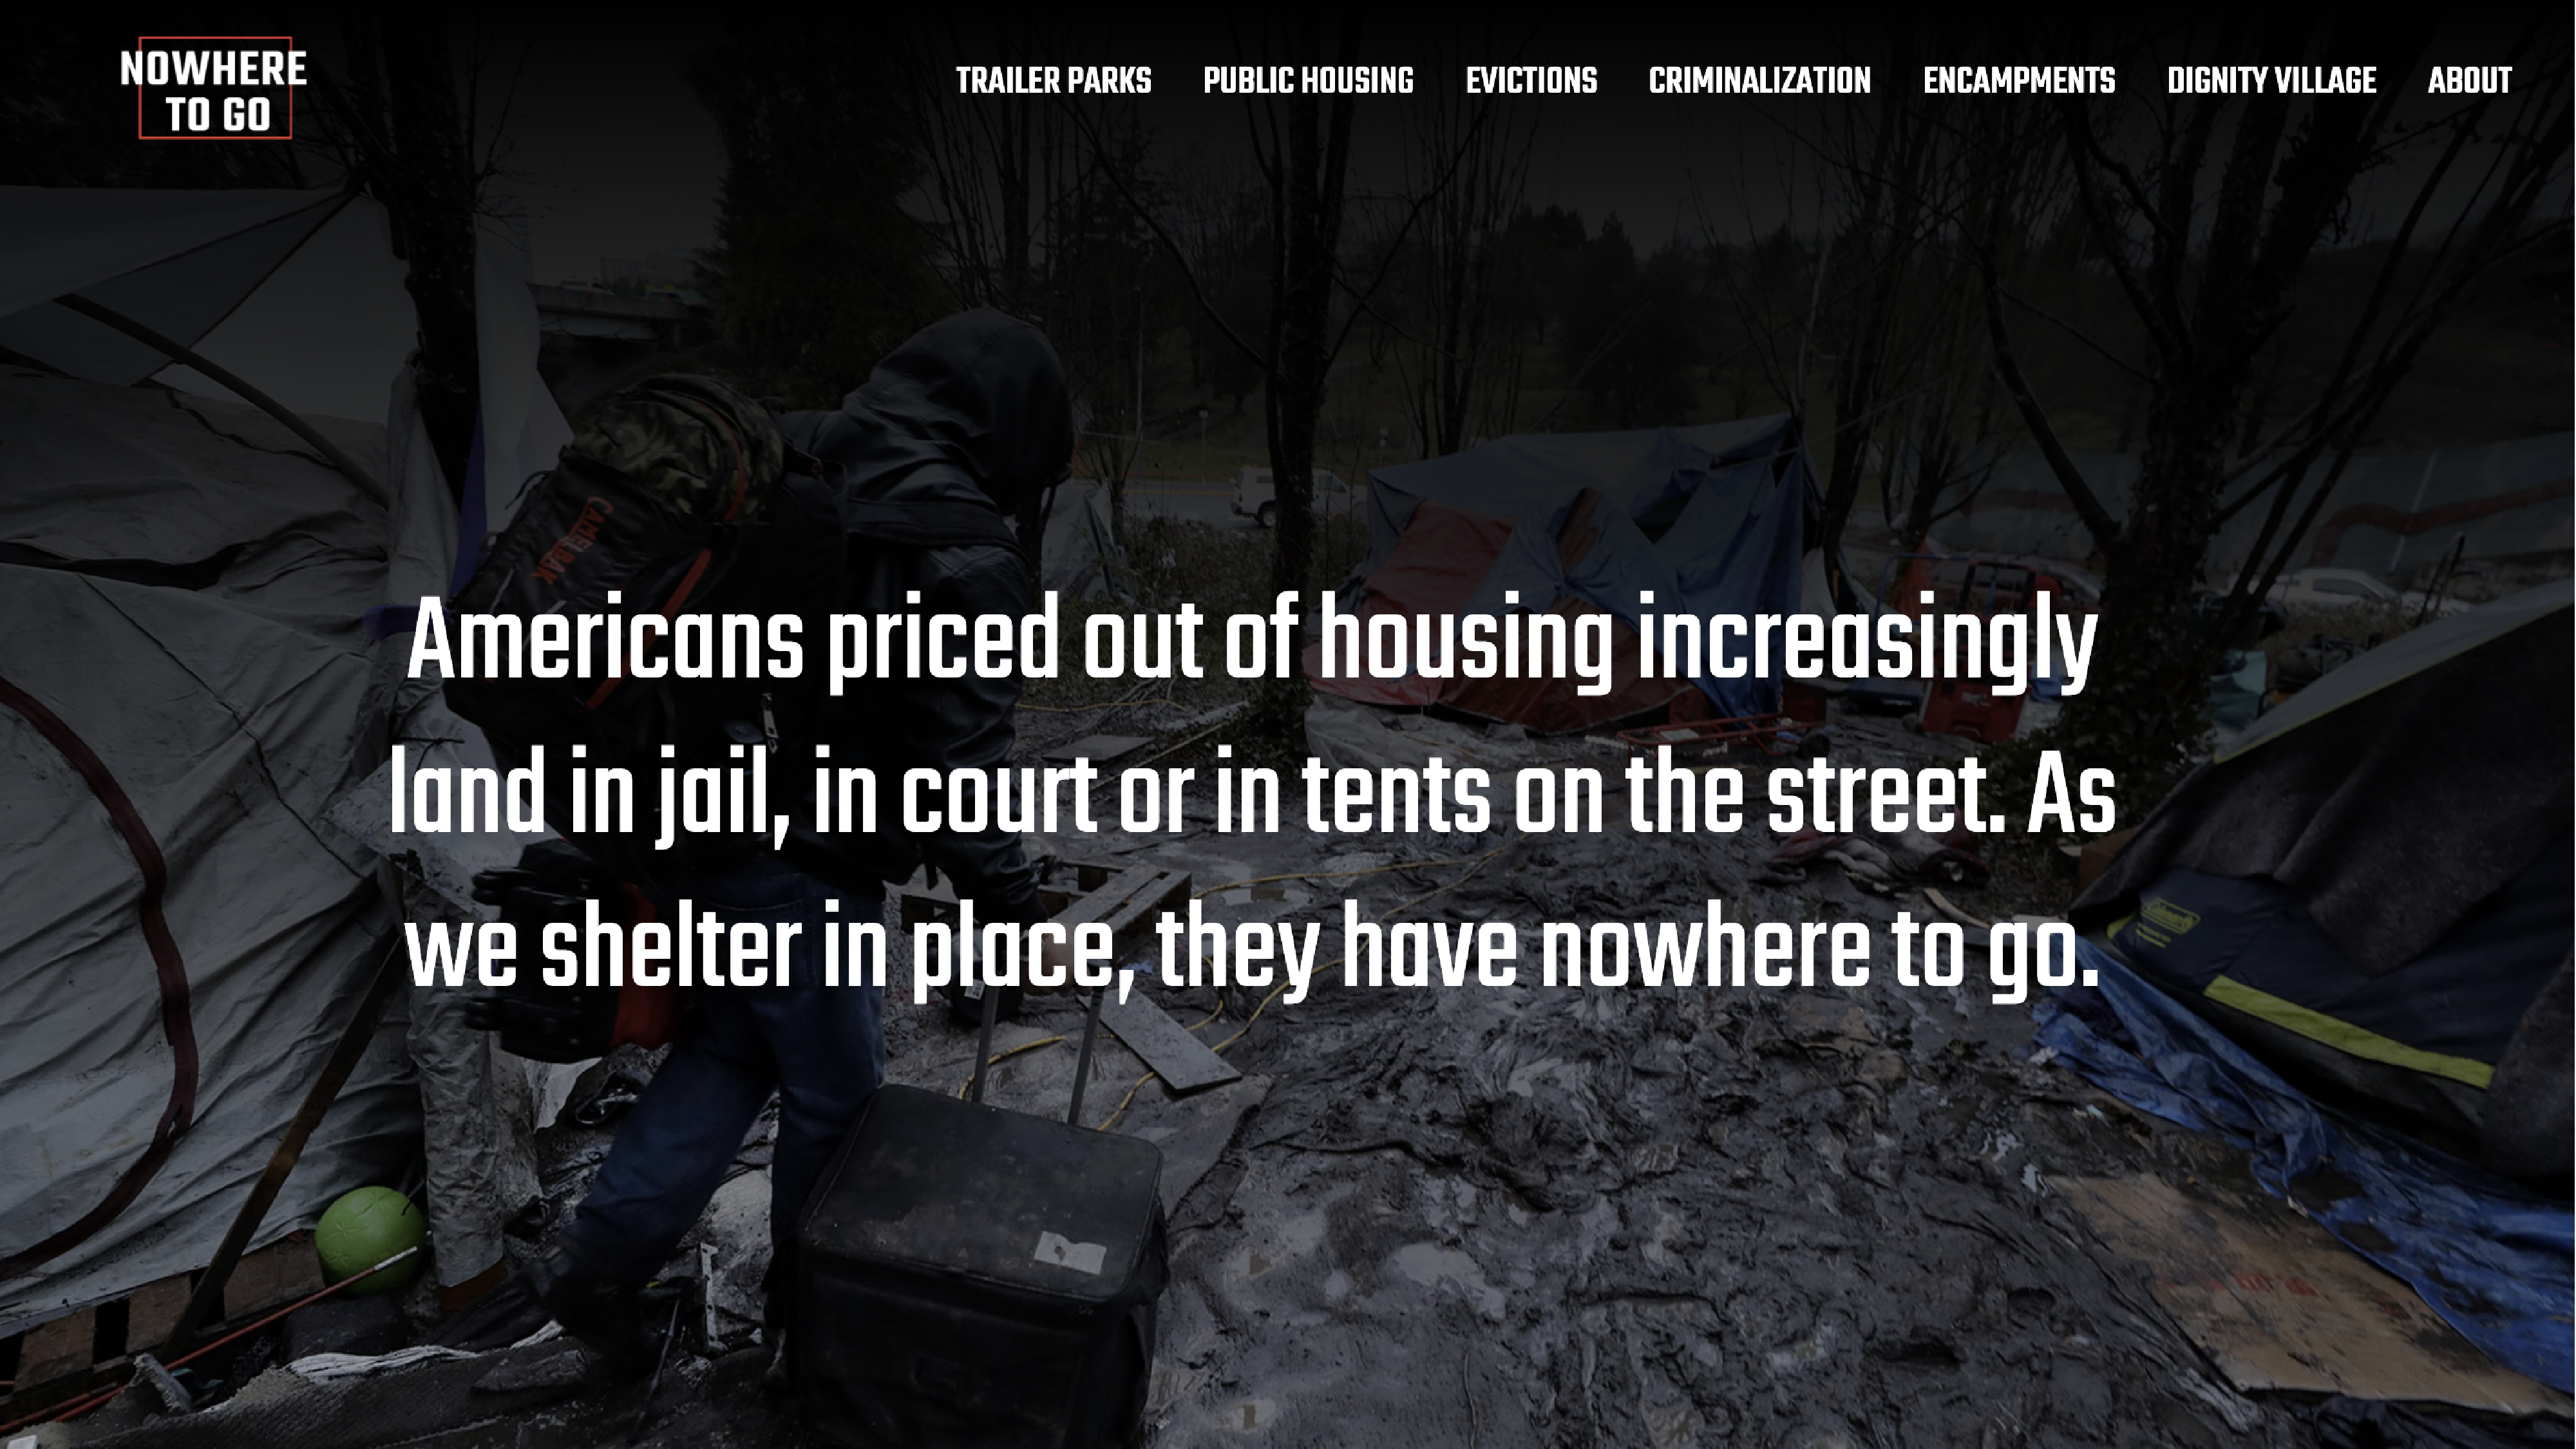
Nowhere To Go Website
What I did: Designed project branding, developed the site infrastructure, and produced stories and data visualizations.
What I used: HTML, CSS, WordPress, XD, Photoshop, Datawrapper
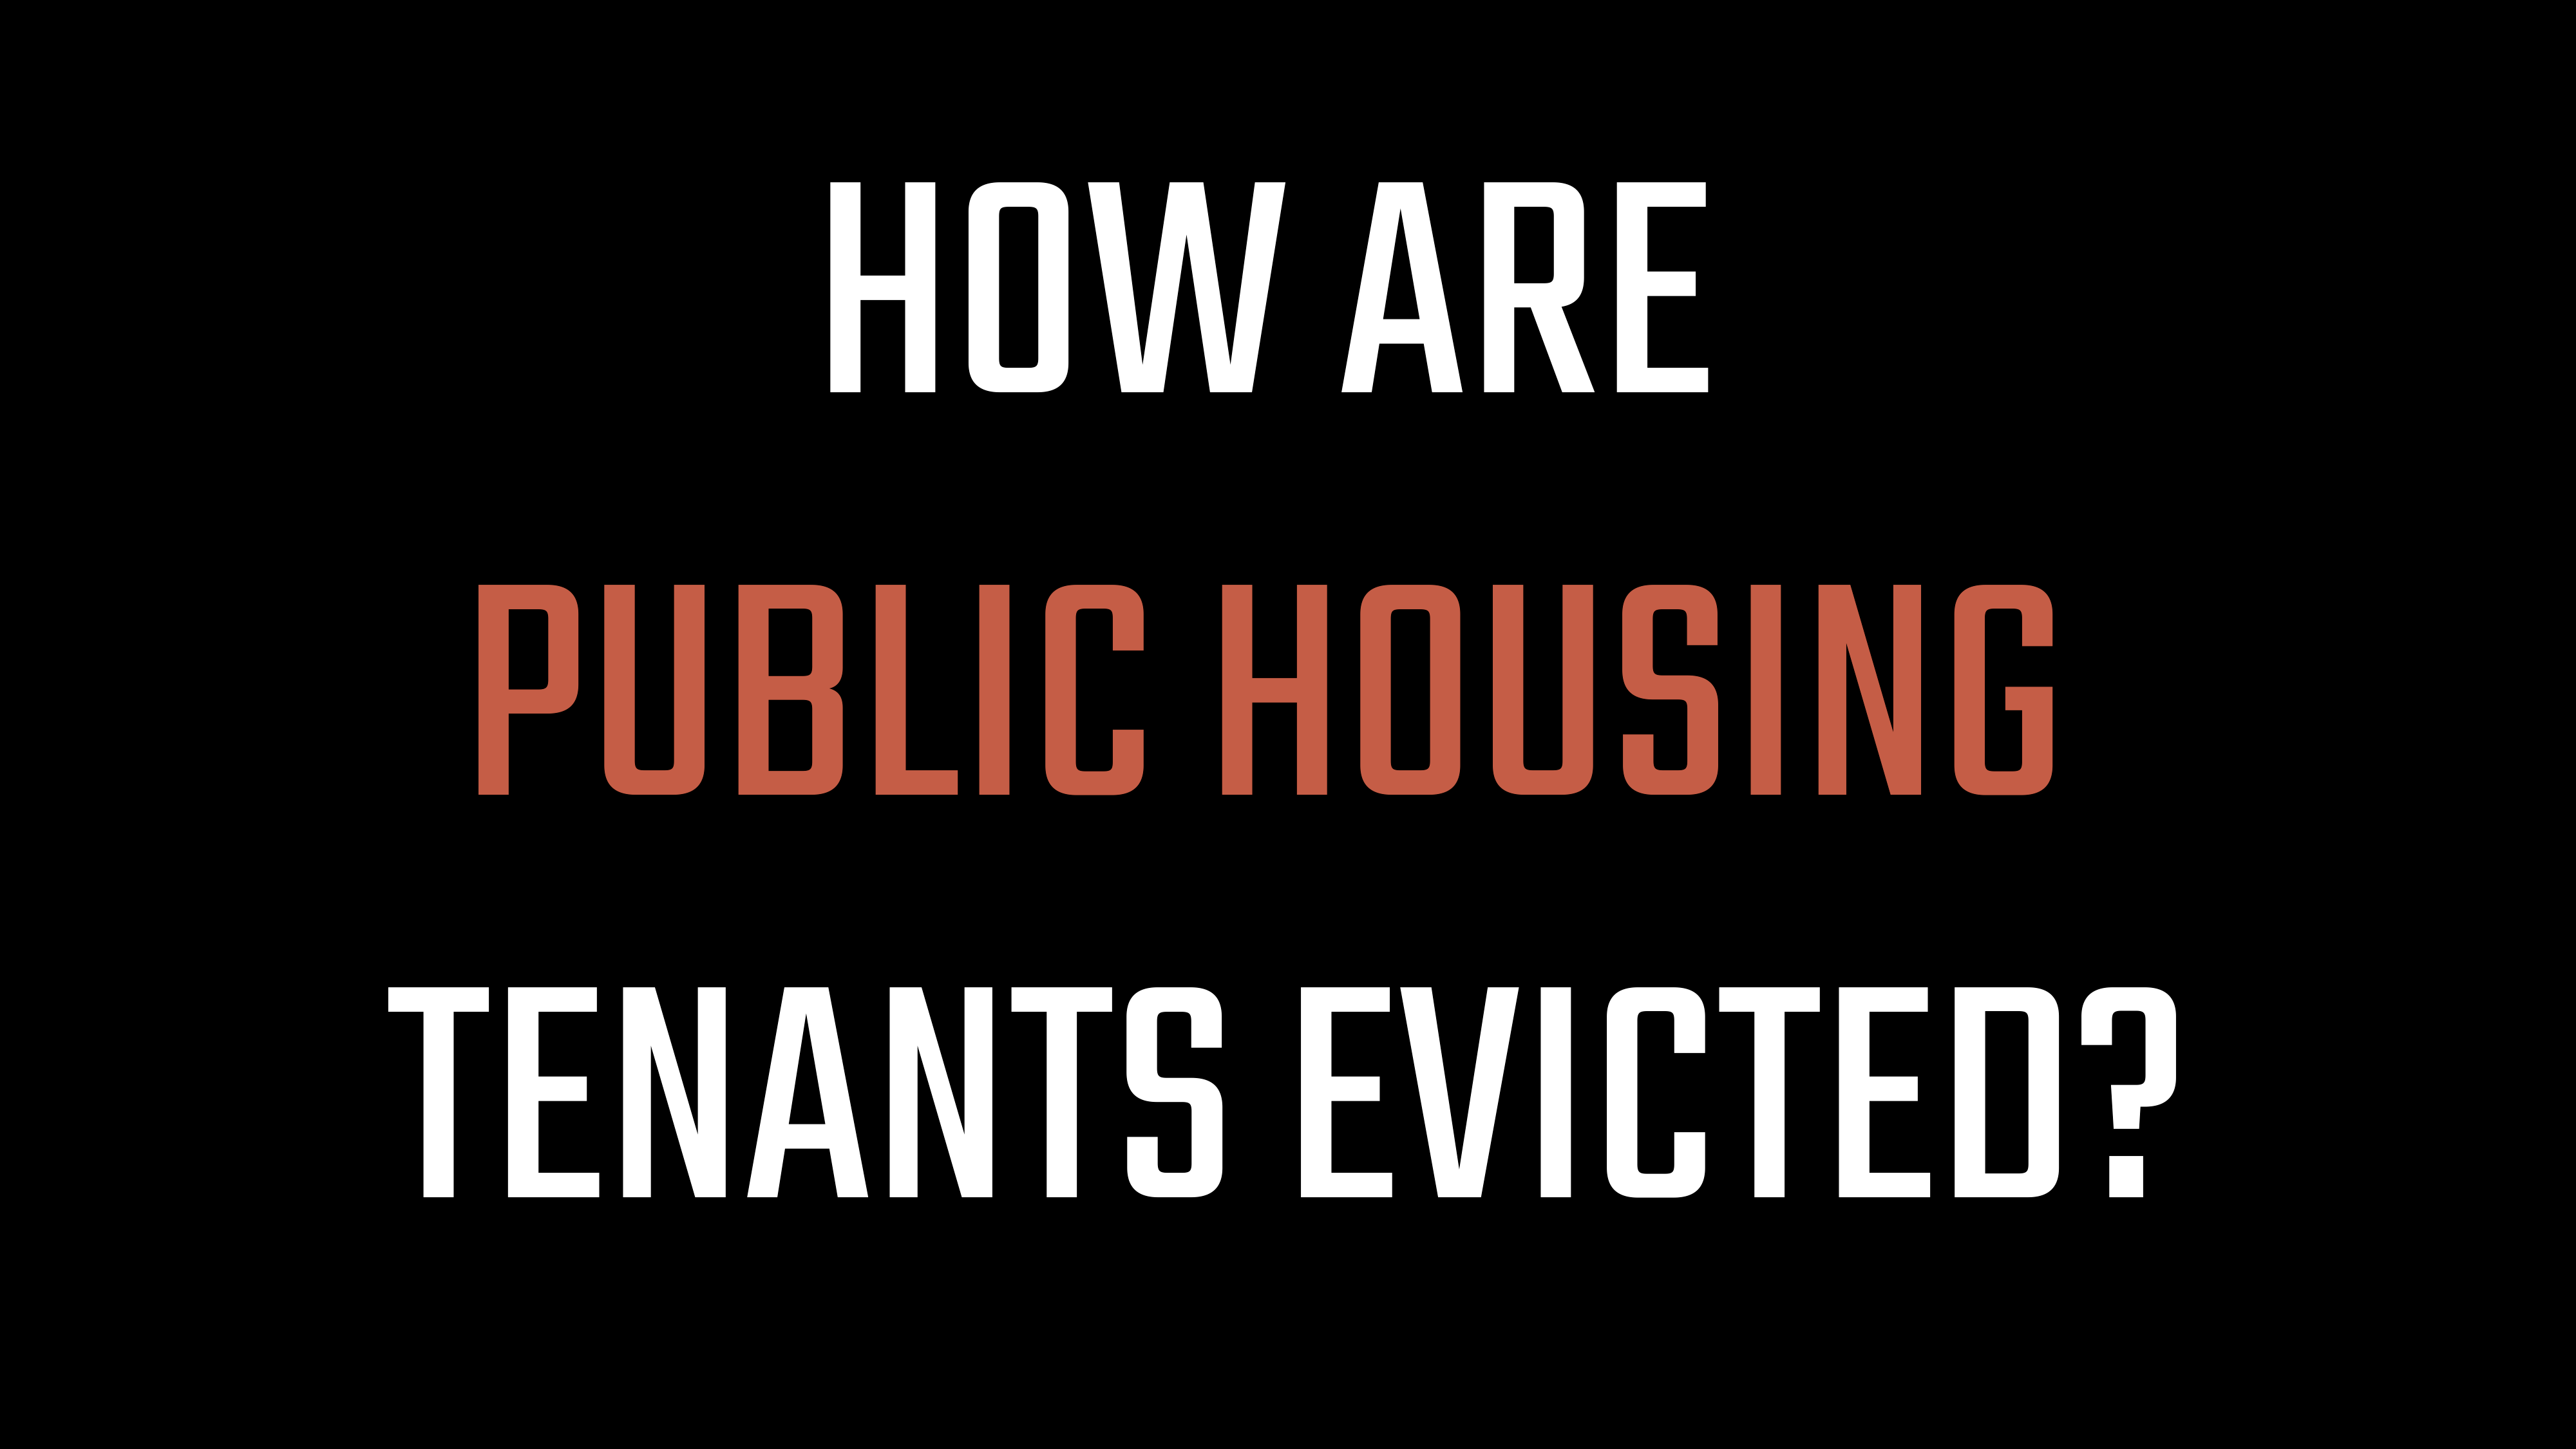
Public Housing Motion Graphic
What I did: Illustrated and animated the process of how public housing tenants are evicted.
What I used: After Effects, Premiere, Illustrator, Photoshop, YouTube

Evictions Motion Graphic
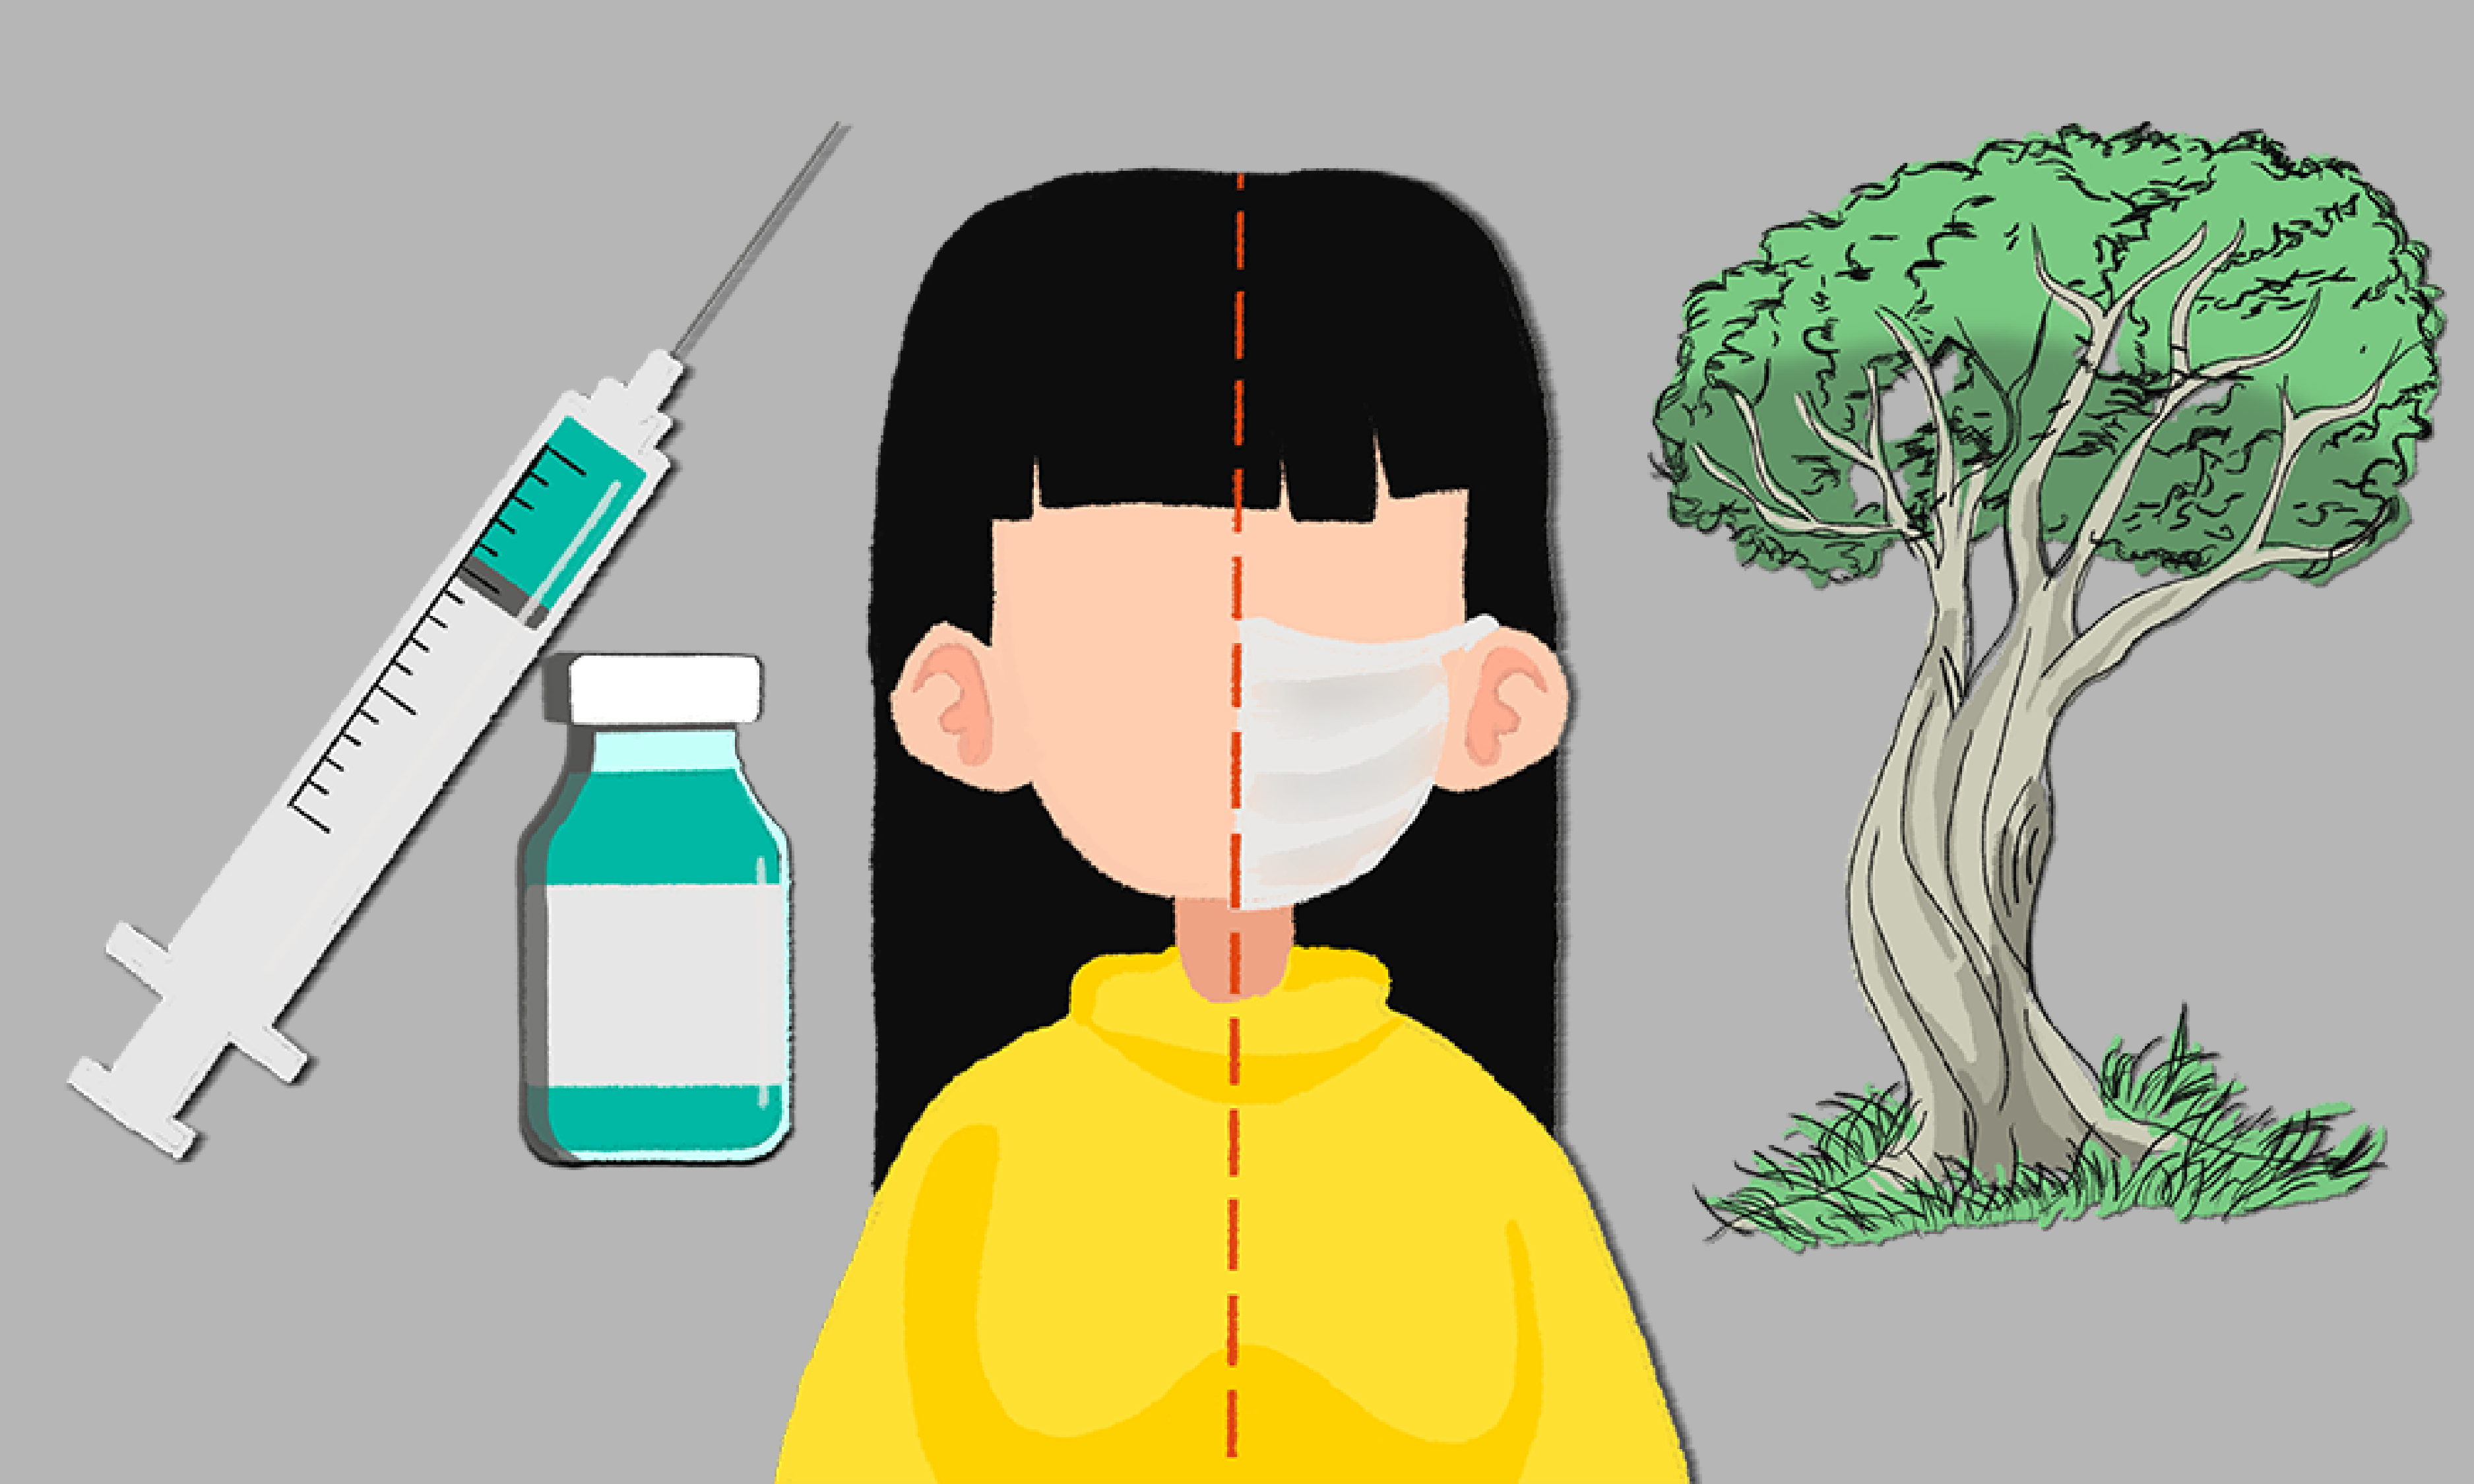
What I did: Illustrated and animated how individuals can be evicted and how pandemic eviction moratoria impacted them.
What I used: After Effects, Premiere, Illustrator, Photoshop, YouTube